Making Maps for Yale Law Journal
I recently had the pleasure of making a few fun maps for Professor Maureen E. Brady’s new article in the Yale Law Journal: The Forgotten History of Metes and Bounds. You can read the full thing as featured in Volume 128, Issue 4, here. Brady describes the piece as follows:
Since long before the settling of the American colonies, property boundaries were described by the “metes and bounds” method, a system of demarcation dependent on localized knowledge of movable stones, impermanent trees, and transient neighbors. Metes and bounds systems have long been the subject of ridicule among scholars, and a recent wave of law-and-economics scholarship has argued that land boundaries must be easily standardized to facilitate market transactions and yield economic development. However, historians have not yet explored the social and legal context surrounding earlier metes and bounds systems—obscuring the important role that nonstandardized property can play in stimulating growth . . . Using new archival research from the American colonial period, this Article reconstructs the forgotten history of metes and bounds within recording practice. Importantly, the benefits of metes and bounds were greater, and the associated costs lower, than an ahistorical examination of these records would indicate. The rich descriptions of the metes and bounds of colonial properties were customized to the preferences of American settlers and could be tailored to different types of property interests, permitting simple compliance with recording laws. While standardization is critical for enabling property to be understood by a larger and more distant set of buyers and creditors, customized property practices built upon localized knowledge serve other important social functions that likewise encourage development.
Brady describes, at length, the history of metes and bounds, a parcel demarcation system that entailed using descriptions of physical markers, like rocks, streams, and other geographic features, to identify property boundaries. A particularly interesting historic detail of metes and bounds is how the ritual of perambulation — communal walks about the property borders — was essential to its longevity. Brady writes,
The ritual of perambulation could involve much more than merely walking the outskirts of property. Perambulation was also known as “beating the bounds.” Inhabitants of the community would walk around the relevant property, literally striking the boundary line—as well as any markers in it—with sticks, stones, and willow tree branches. Both adults and children went along for the affair. The express purposes of these perambulation procedures were “to make sure that the bounds and marks were not tampered with, to restore them when displaced, and also to establish them in the memory of the folk.” Indeed, the reason for involving children was so that “witnesses to the perambulation should survive as long as possible.” A child might be picked up and flipped, so that the child’s head would touch the boundary.
In addition to offering some charming insight into perambulation, Brady offers a sort of redemption story for metes and bounds, which, as she reports, “have generally been met with derision from surveyors, lawyers, and scholars.” In particular, Brady’s article responds to recent law and economics literature by Gary Libecap and Dean Lueck, which found that a standardized “rectangular system” lowered transaction costs, yielding higher property values in some western states. Brady offers a narrative of the social benefits that metes and bounds yielded that have largely been overlooked by the law and economics literature.
We made four maps for the piece, each exploring the differences between the metes and bounds parcel demarcation system, as compared with standardized property boundaries.
Figure 1
First, Brady wanted to make a map of somewhere in the states, present day, where the legacy of the metes and bounds system would be visible in the geography, adjacent to land that had been historically demarcated using standardized systems. We spent some time zooming around in Google Maps and ultimately decided to map Dudley Township in Ohio. We traced visible property demarcations from aerial imagery, namely roads. Unsurprisingly, areas in grey were demarcated using standardized systems and areas in white were historically demarcated with metes and bounds.
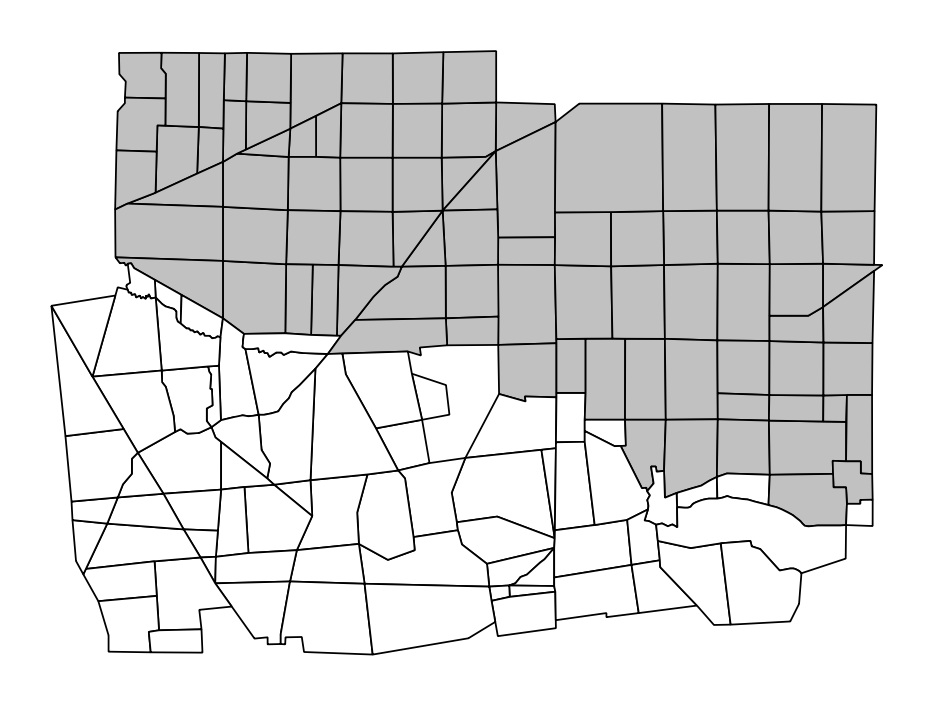
Figure 2
Next, Brady wanted us to give a few more depictions of how the metes and bounds system and standardized system amounted to very different spatial patterns of property demarcation. On the left is a depiction of lots in the Virginia Military Reserve, Ross County, Ohio, (from some time between 1799 and 1826). We traced those lots from some historical maps. On the right is a depiction of parcels in Carroll, Nebraska (roughly 1918), also traced from some historical maps.


Figure 3
Next, Brady wanted us to a prepare a visualization of a simplified lot and tier system for identifying parcels. We based this visual on some descriptions from New Haven Town Records from 1649-1684, (Volume 2).

Figure 4
Finally, Brady wanted to trace the parcel system in the Oystershell Development in New Haven, the location of her case study. We worked from a historic map for tracing the parcels and used another historic map of New Haven to place the parcels on top of the modern grid. Brady uses the story of the Oystershell Development to explain Connecticut’s legislative response to the rising number of property disputes in the colony’s cities in the early eighteenth century and the difficulty that the colony was having gaining control over the settlement of land. As she explains, many of these property disputes were caused by metes and bounds. Some of these legislative changes included standardizing the shape and contour of new lots, such as those in Oystershell.

At this point, I am not a zealous advocate for a return to metes and bounds, but this mappy historical divergence with Brady was a treat. She has another forthcoming article, "Property Convergence in Takings Law," to be published soon in Pepp. L. Rev., to keep your eye out for.
