
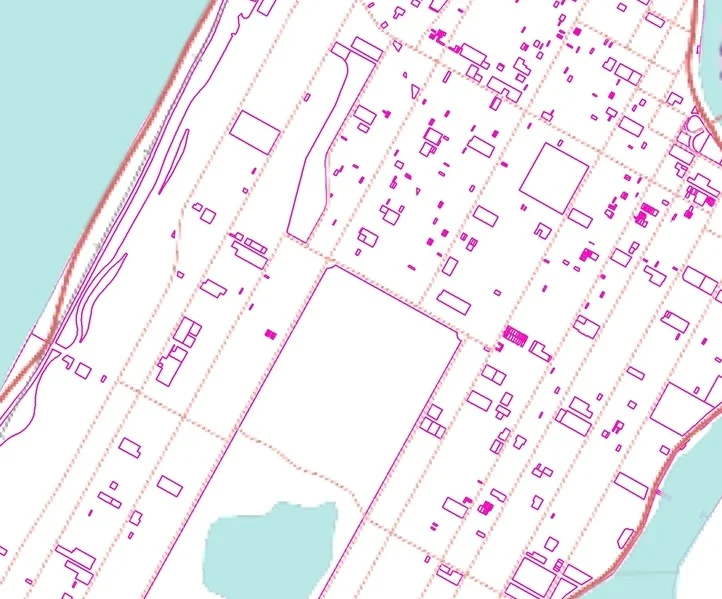
Generating Jersey City Building Footprints
I mapped every building in Jersey City. Learn how, why, and what you can do with it. Browse the code & download the data from Jersey City open data portal or OpenStreetMap. Made with JOSM, QGIS, & Mapbox GL JS.

Mapping Race, Crime, and District Attorney Elections in NYC
Mapping NYC race and ethnicity, misdemeanors and felonies, and voting in DA-elections for Prof. Issa Kohler-Haussman, in preparation of the launch of her new book: Misdemeanorland.
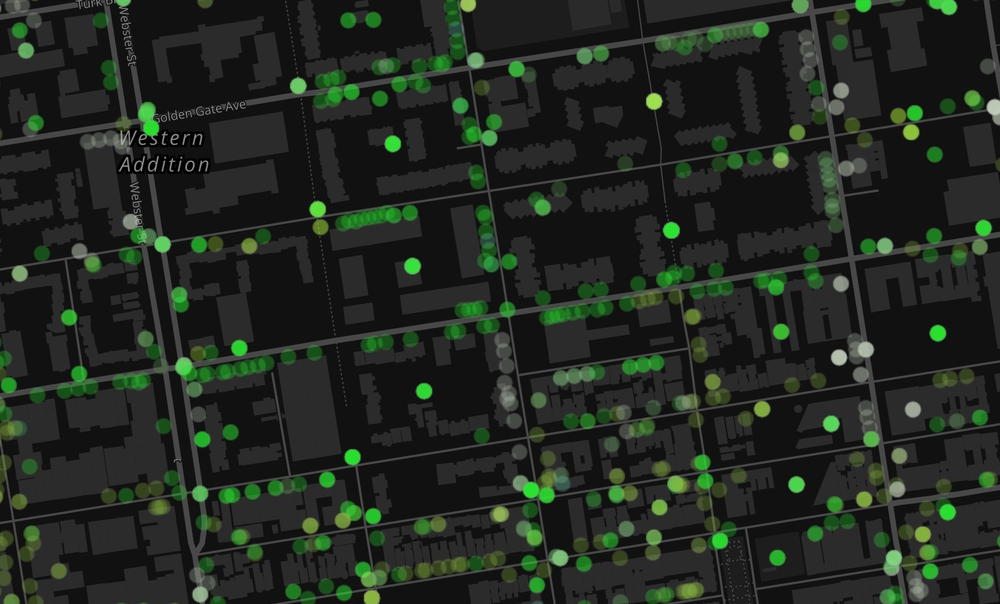
San Francisco Street Tree Census
An interactive map of every tree in San Francisco with genus, species, legal status, official caretaker, plant date, plot size, etc. Made with SF open data & Mapbox.
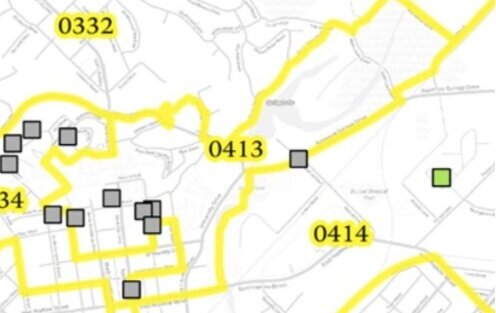
Making (More) Maps for the Yale Law Journal: Protecting Student Voting Rights in Texas
Mapping the “wide variety of obstacles that can deter [students] from democratic participation.”

Eerily Circular Cities
An exploration of cities in Georgia with nearly perfectly circular administrative boundaries. Made with QGIS & census data.

Mines and Mapbox GL
Example (with code) of a quick map using MSHA data and the new Mapbox GL JS: all mines in the US with toggleable satellite imagery and streets basemaps.

Damage Done to Manhattan Streets in a Year
Timelapse map of one year of damage to NYC streets. Made with NYC open data and ArcMap.


Making a Calendar out of Cahill's Projection System
A 2015 calendar inspired by the Cahill-Keyes projection system.

Sexual Health in Harlem (RiSE)
A spatial study of sexual health in Harlem conducted in 2012 for Barnard/Columbia Design for America's RiSE (Reinventing Sexual Health) Team. Made with ArcGIS.
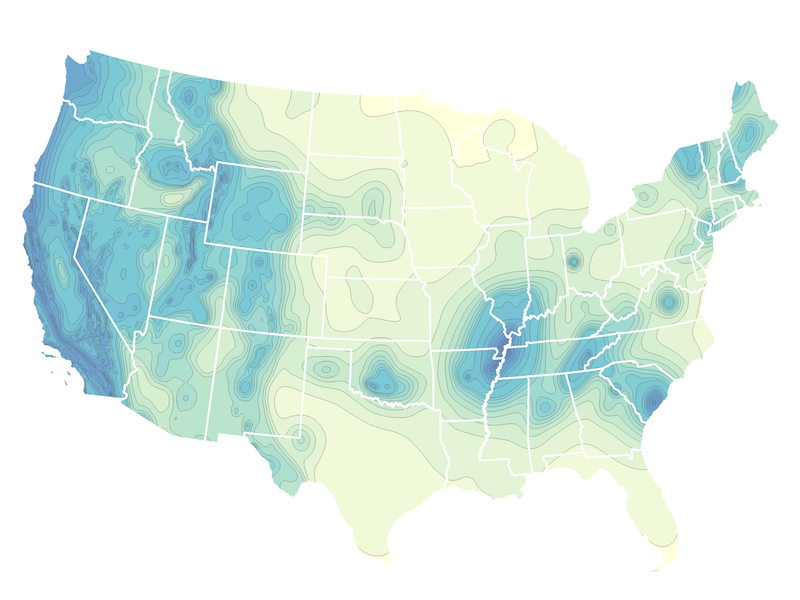
USA Earthquake Hazards
Earthquake hazard regions across the US.

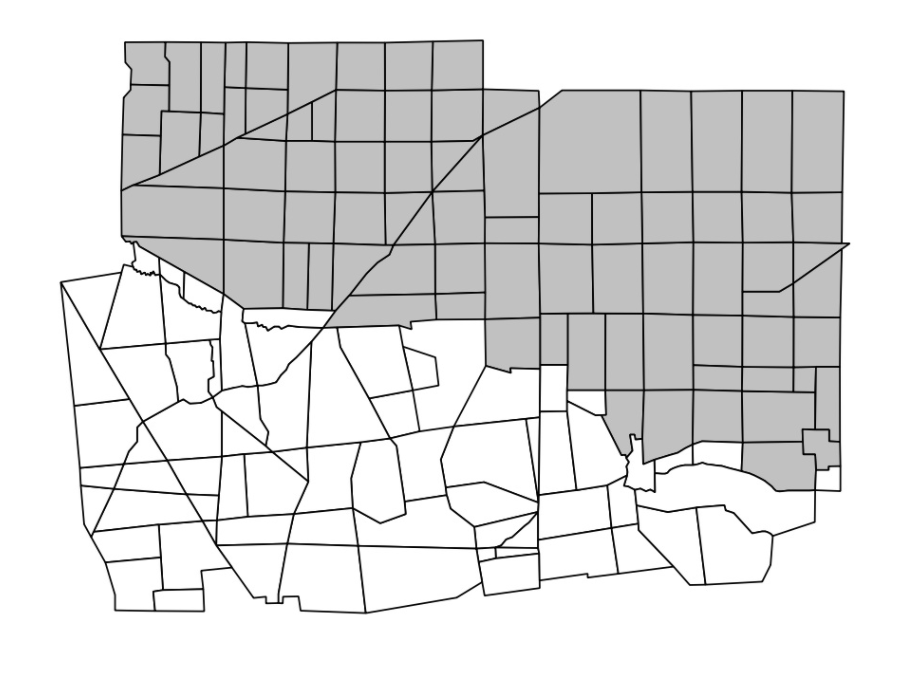
COVID-19 Hospital Capacity and Incarcerated Populations: Making Maps for ACLU Wisconsin Original Jurisdiction Suit in WI Supreme Court
This April, I worked with litigators, public health experts, and the Wisconsin ACLU to produce a series of maps for a lawsuit in the Wisconsin Supreme Court seeking the release of vulnerable inmates from state prisons.

3D Zoning in Jersey City
A 3D map of all buildings in Jersey City. Made with Mapbox Web GL JS and data I made in an earlier post.

Mapping Jersey City Heights
A tutorial in generating building footprints for any city using OpenStreetMap and JOSM, classifying shapefiles by landuse using open source QGIS, and using the qgis2web tool to make a webmap.
Making Maps for Molly Brady in the Yale Law Journal
Behind-the-scenes making a few fun maps for Prof. Maureen Brady’s new article in the Yale Law Journal: The Forgotten History of Metes and Bounds (Vol. 128, Iss. 4), which entailed digitizing some old archival maps of New Haven, Connecticut.

One Size Does Not Fit All Data Science
Paper coauthored with Alex Albright, exploring how mainstream data scientists are (and are not) equipped to contribute to social good projects. Presented at 2015 Bloomberg Data for Good Exchange and also at the 2015 Strata + Hadoop World Conference.

Clustering San Francisco Crime Data
An interactive map of clustered crime data in San Francisco, from SF open data. Includes code for k-means clustering in python.


San Hoboyorkesey
A composite map of the cities in lived in: Jersey City, Hoboken, New York City, & San Francisco. Made with open data from each city & ArcGIS.
What NYC Owns in NYC
A tutorial of how to extract a shapefile of city-owned properties in NYC from MapPLUTO data using ArcGIS.

Manhattan Maps
A series of maps of NYC using NYC open data. Includes maps of building ages, sizes, and heights, wifi hotspots, street types, traffic counts, and elevation.

Building Heights in San Francisco
Quick and sloppy mapping with SF open data and QGIS.