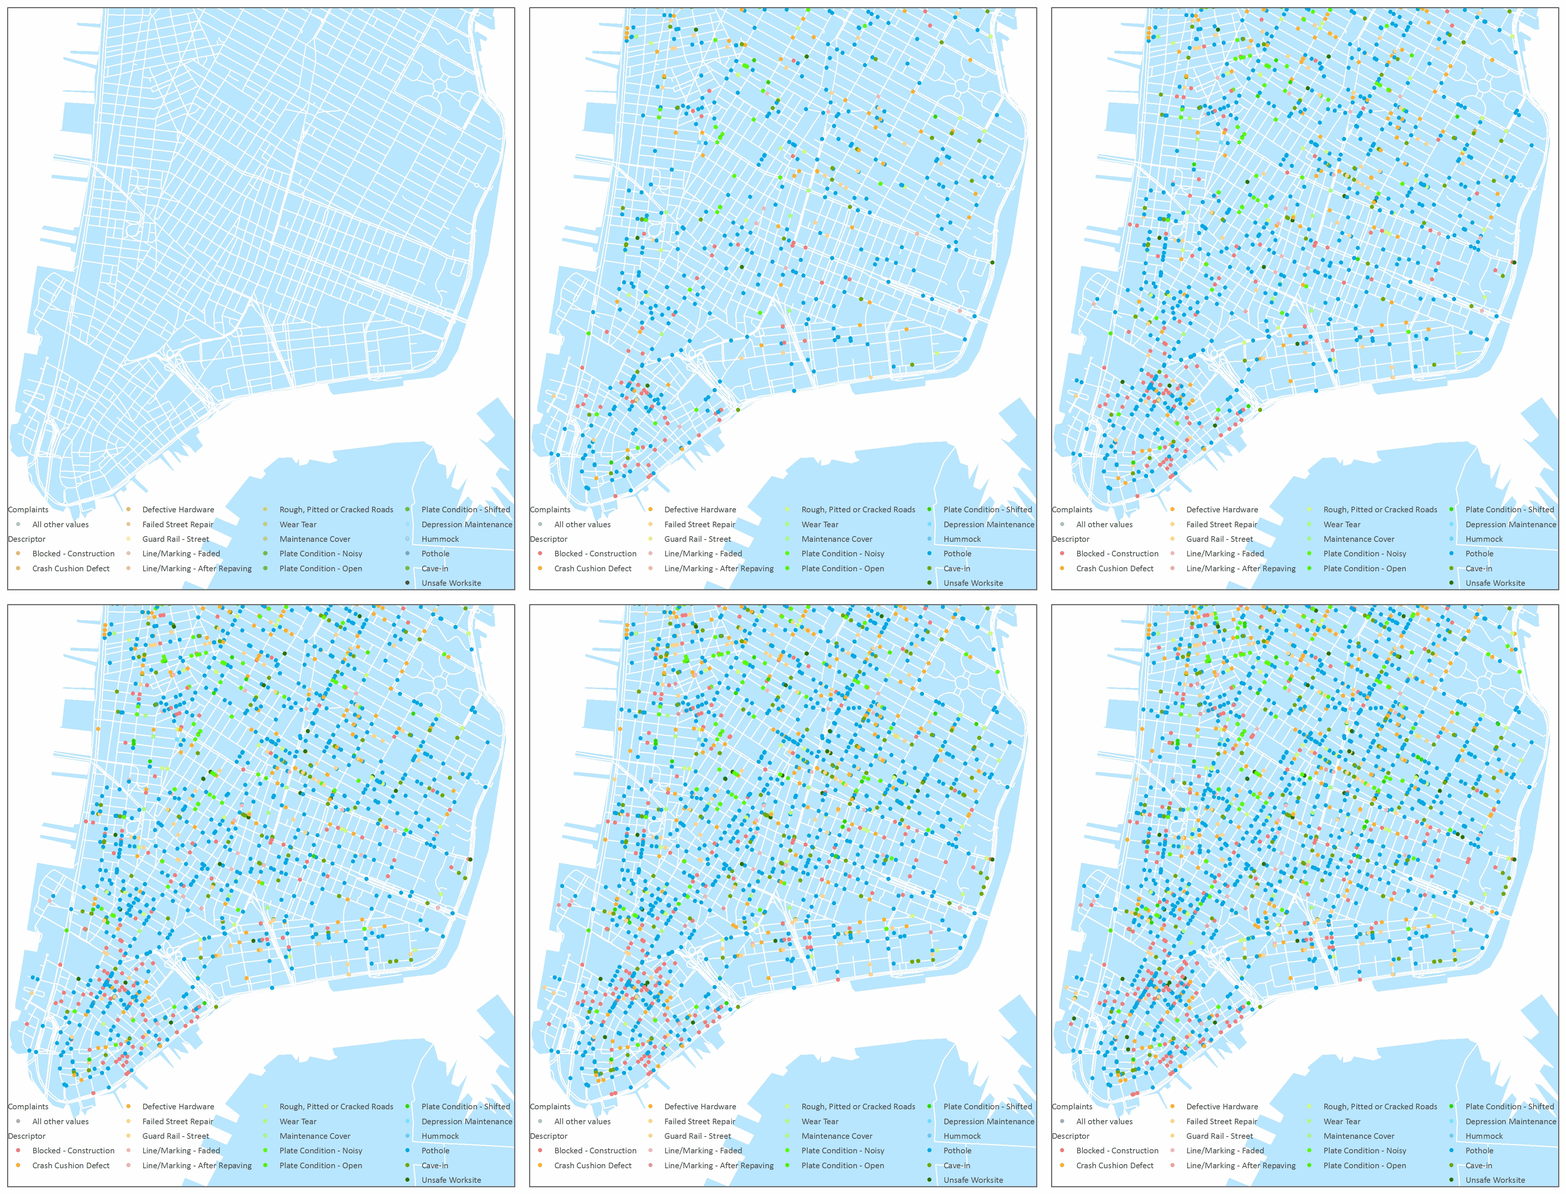
Mapping The Damage Done to Manhattan Streets in a Year

NYC DOT collects 311 complaints about roads. I animated the damage done over 2012 to visualize the beating that Manhattan streets take. It's no surprise that potholes are the biggest complaint, with practically one or more on every block. There is a scary number of "unsafe worksite" and "cave-in" (gah!?) reports.

This was a good project to experiment with the relative advantages of using a time slider to export to a movie versus building a GIF. The time slider works well but is fickle, and I find the enable time feature to be limiting. Some other features aren't as adaptable as I'd like them to be - for example, displaying the legend and identifying the best time increments. On the other hand, building the GIF is tedious. My computer is so slow with video that making GIFs was somehow faster.

What I had really hoped to do with this data was to visualize complaints as they happen throughout the year, and then have the points disappear as the complaints are addressed. This might give insight into which complaints and neighborhoods get the most and least attention. It became clear as I built the animation this way that the DOT system for reporting a complaint as "closed" is pretty arbitrary. The "closed" dates for each report were always close in time to some cluster of complaints, and stretched precisely a month apart, looking suspiciously like any given pile of complaints that might have accumulated on a desk over a month were all closed out before some analyst deadline.

All Upper Manhattan reported street complaints in 2012 every 19 days. All Lower Manhattan reported street complaints in 2012 every 19 days. Data from NYC Open Data 2012 311 complaints to the Department of Transportation.

 
UWS
 
 
LM
 

All The Places I Have Lived

I made a little map of the places I have lived. 

I got shapefiles of Hoboken and Jersey City streets from Hudson County, Manhattan streets from NYC Open Data, and San Francisco streets from their Open Data portal. 

I used three dataframes, which is a pretty terrible and hacky way to approach this. The three layers and frames were all zoomed to different scales to line up the cities, so formatting the lines to make it look uniform was a challenge.

I manually parsed a bunch of streets, making the density of the grids consistent in each city, and connecting major thoroughfares between between them. 6th Avenue became Palisade Avenue pretty seamlessly. Merging south San Francisco's streets was not quite so elegant, but I blame San Francisco streets.

If anyone knows a smarter way to join lines to this effect, let me know.

Inspired by You Are Here: Personal Geographies and Other Maps of the Imagination by Katharine Harmon.


All maps are fictional and sentimental, this one just a little more. 


Finding What NYC Owns in NYC

Way back in February, an old job asked me to try and parse City-owned and Leased Property (COP) in NYC from an Open Data file listing COPs in the five boroughs. The struggle with uniting this list with a tax map to visualize city property was that the city identifies parcels with a BBL - Borough, Block, and Lot identifier - and in the City-owned and Leased Property list, the BBL was recording as a single attribute. MapPLUTO's, the city's tax lot database represents the BBL as three discrete attributes. 

Unfortunately, even after I generated three discrete BBL attributes in each layer, GIS barely accommodates joining two layers by more than one common attribute. After plenty of experimentation, I can report the best way to accomplish this is a Make Query Layer tool with a quick SQL expression.

These were my specific methods to join the tables and isolate the COPs: 

(1) Get City-owned and Leased Property (COP) list. 
(2) Get Manhattan MapPLUTO parcel info (MNMapPLUTO)
(3) Add "Borough_1" field to MNMapPLUTO and use field calculator to make "Borough_1"="1" where "Borough"="MN" to make sure the borough identifier is common - 1 for MN - among the COP table and MapPLUTO layer. 
(4) The parcels and COP table can be joined by their BBL (Borough, Block, Lot) numbers but unfortunately the BBL# is stored as three separate attributes, so use "Make Query Layer" tool to join the fields by their three respective attributes, using the SQL expression: ("COP.borough"="MapPLUTO.borough" AND "COP.block"="MapPLUTO.block" AND "COP.lot"="MapPLUTO.lot"). 
(5) Import new query layer into filegeodatabase.

Message me for final COP shapefile.