Mapping Jersey City II: Every Building

SEE IT LIVE. SEE THE CODE. LEARN WHY.

If no map appears below (if there's a white background) it's probably because you need to enable WebGL in your browser.

It's been a long-term dream of mine to map every building in Jersey City. See my last post for more about why.  I reached out to the Office of Innovation to see how to go about doing it and they gave me the green light, so I had to pull the trigger.

Once I created the building footprints using the process documented in my last post (these polygons now live in OpenStreetMap) I used QGIS to merge on several other publicly available datasets from the city including zoning, wards, and parcel information. I did my best to make the data comply with the Project Open Data Metadata Schema v1.1 as per their request. 

The zoning and wards merges were extremely clean and easy. The parcel merge was not, to say the least. There are often many buildings inside one parcel (Mun-Bloc-Lot-QCode) or many parcels inside one building. In the first case, I allowed buildings to inherit all parcel information. In the second case, I populate the Lot and Bloc fields with "MANY" as necessary. QCodes, which identify the smallest parcel boundary, were almost never uniquely identifying, so I exclude them. Mun-Bloc-Lot is sufficient to join with county assessment and tax information. 

I completed the parcel merge by calculating building centroids and spatially merging those with parcel polygons (preserving a unique building identifier). I experimented with other methods (like parcel centroids inside building polygons), but I found this method to be the cleanest and require the least manual clean-up. I found the realcentroid plugin extremely helpful, considering some geometry irregularities. I also found the QuickMultiAttributeEdit plugin to be extremely useful for updating the fields on a few objects that merged sloppily.

I used one of my favorite plugins, qgis2web, to produce a quick and sloppy Open Layers 3 web map to immediately send to my favorite people. Unfortunately, I don't think the plugin is equipped for a dataset this large, so I wasn't able to use it to produce a Leaflet map (my preference). A little formatting with the Table Manager plugin and I sent the data off to the city with a data dictionary. They're in the process of putting it up on the Open Data Portal now.

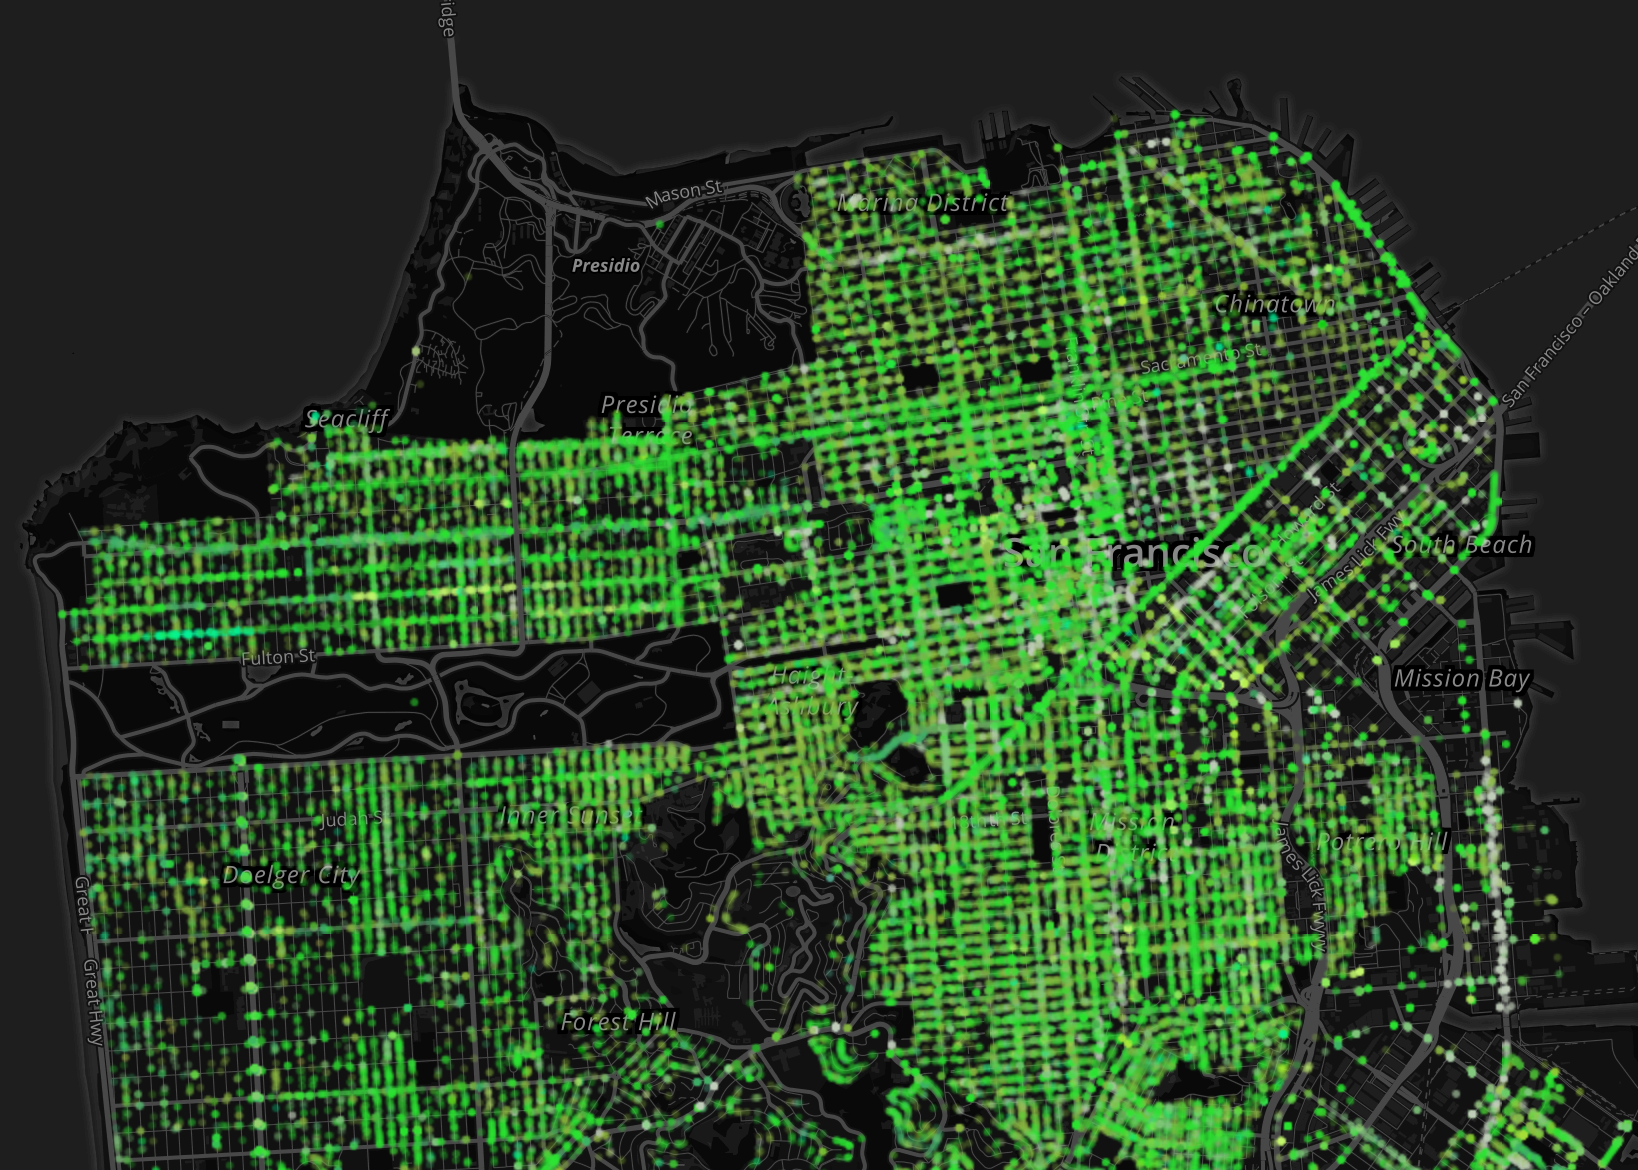
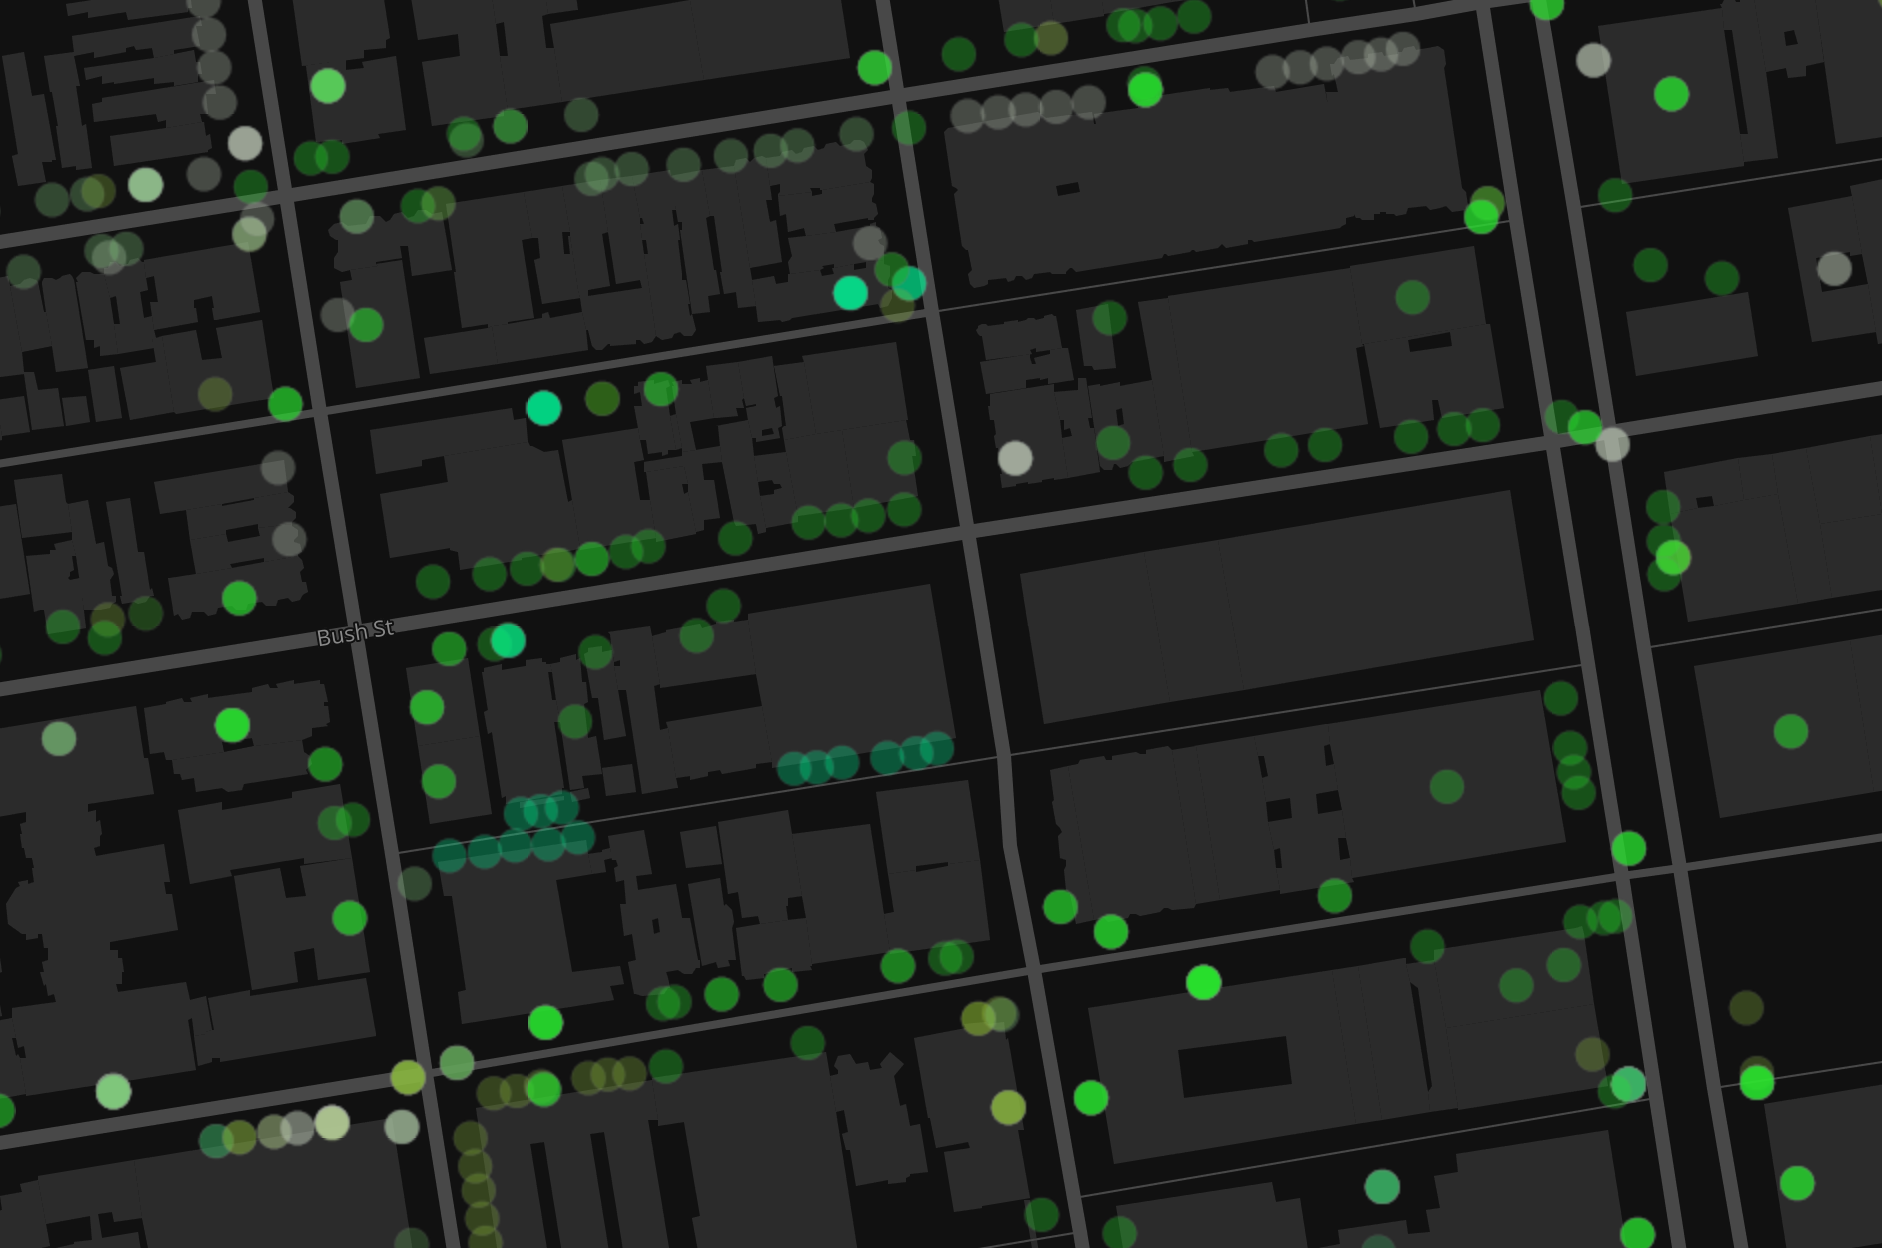
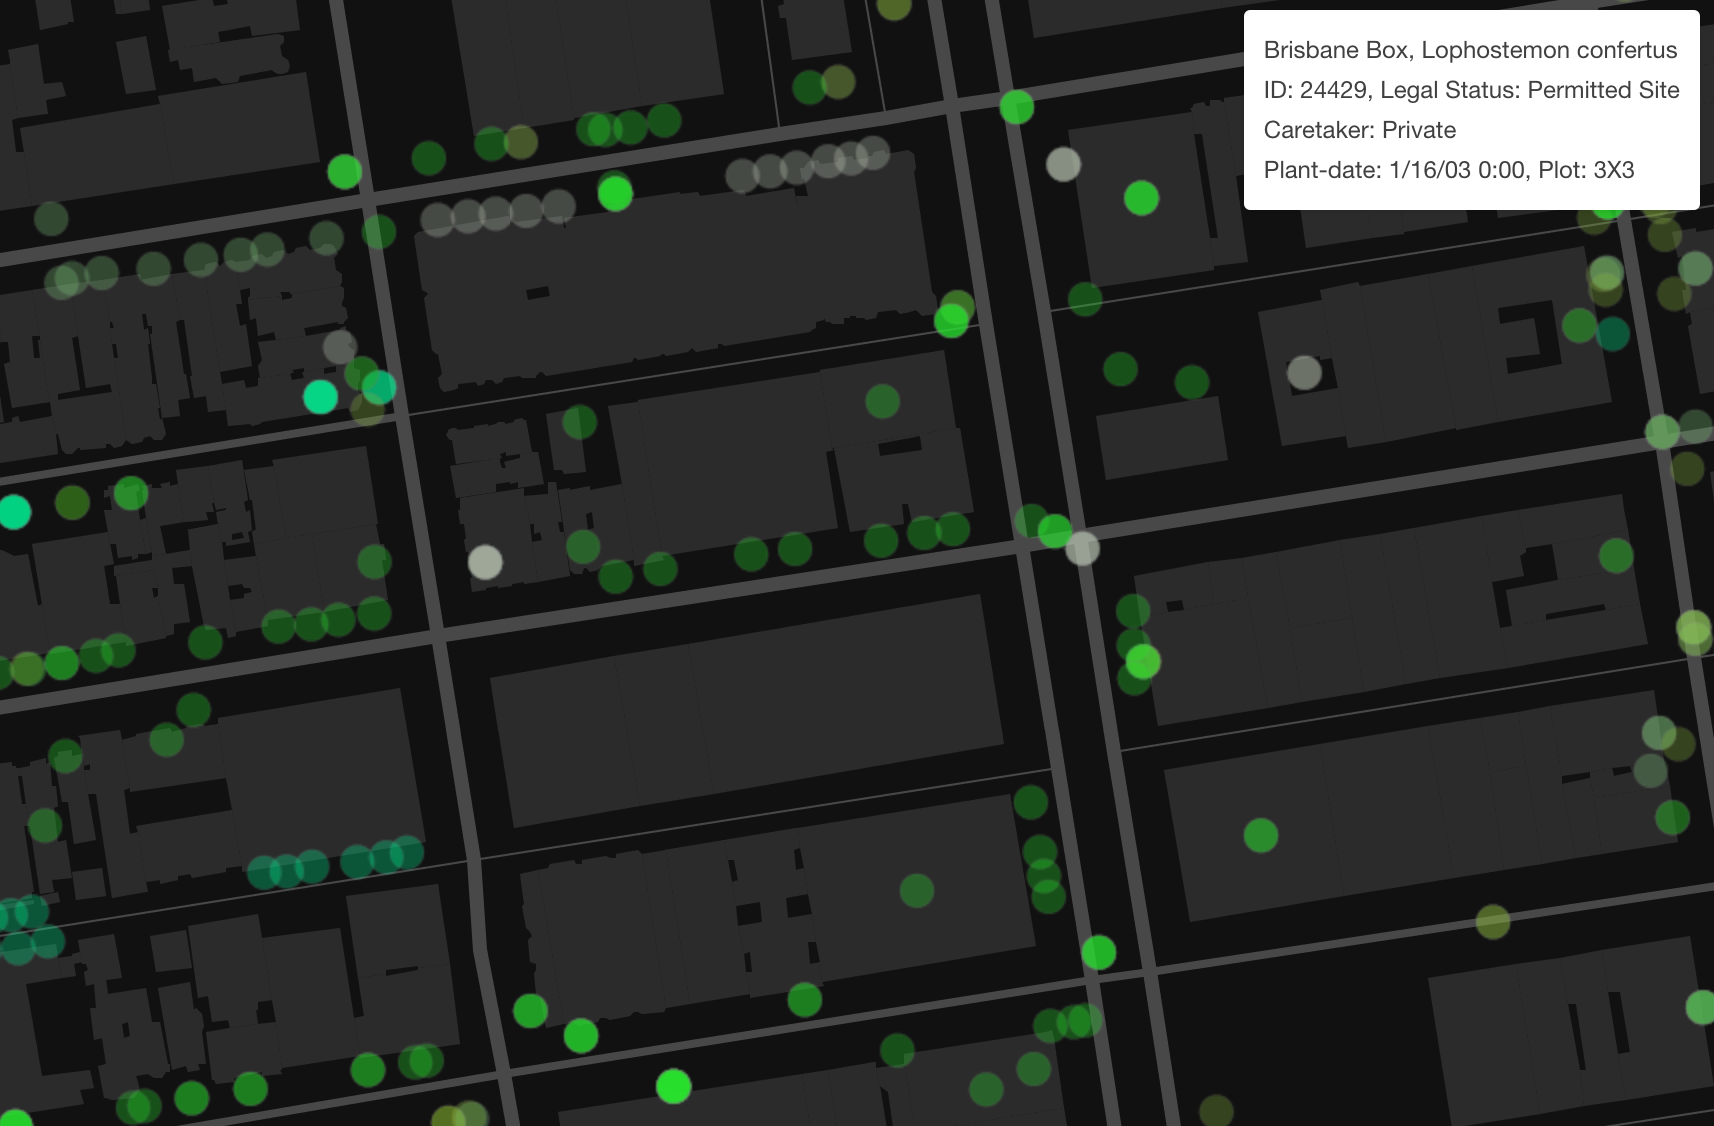
Finally, I uploaded the geojson with footprints and all of the merged fields into Mapbox studio as a tileset. I added it to two styles: one dark basemap and one satellite imagery layer with semi-transparent road information. Finally, I used Mapbox GL JS to code the map shown above. I added an overlay and a legend, and functionality to click on buildings for their information, and toggle between my two basemap styles. I then agonized over colors, added Google fonts, and promptly went to bed.


Things to do and problems to solve:

(1) To solve: It would be great to see the whole city at once, but the dataset is so large that Mapbox enforces that it only be viewable from zoom >=14. I don't love having to pick one part of the city to focus on (at least for the default view), especially because I'm not interested in promoting a downtown-centric image of Jersey City. For now I've settled on what I think is a readily recognizable part of the city.  I would love advice on how to manage this.

(2) To do: Add more data, starting with addresses. This shouldn't be too tricky with some geocoding. This will also make dealing with messy parcel data (and recovering QCODEs) much easier. If I can get that done,  then I can merge on parcel information from the county including owner information, building codes, year built, and building/land assessments. This is definitely feasible (and is just a matter of time). I'd also like to add links to specific, relevant sections of the zoning code for each building. That's another no-brainer.

Mines and Mapbox GL JS

The new Mapbox GL JS is unreal. I made a quick and sloppy map to try out some of the new features. I grabbed a dataset of mines in the US from MSHA's website. I loaded it up into Mapbox and created two styles: satellite imagery and streets. I took some code from their GL JS how-to's and threw it together. My Frankencode is below. Side note: JavaScript is hard. I put in some code to toggle between the two base layers, and to add two more optional layers for hillshade and contours. 

Issues to fix and things to improve in the next version: The dataset was HUGE. I had to limit to zoom levels to keep the size reasonable. You'll notice that if you zoom out too much, the data disappears. I might need to pay for Mapbox to make this work... Also there are two attributions at the bottom of the map for OSM and Mapbox. I do love OSM enough to thank it twice, but I think this has to do with two styles being loaded in. Another thing to investigate with more time.

Cool features: Hold shift and use the arrow keys to fly around. Note how place labels stay horizontal while you spin the Earth as if you stuck a pin in it first. 

Thanks, Mapbox. Here's the code I embedded above.

<html>
<head>
    <meta charset='utf-8' />
    <meta name='viewport' content='initial-scale=1,maximum-scale=1,user-scalable=no' />
    <script src='https://api.tiles.mapbox.com/mapbox-gl-js/v0.12.0/mapbox-gl.js'></script>
    <link href='https://api.tiles.mapbox.com/mapbox-gl-js/v0.12.0/mapbox-gl.css' rel='stylesheet' />
    <style>
        body { margin:0; padding:0; }
        #map { position:absolute; top:0; bottom:0; width:100%; }
    </style>
</head>
<body>

<style>
    #menu {
        background: #fff;
        position: absolute;
        z-index: 1;
        top: 10px;
        right: 10px;
        border-radius: 3px;
        width: 120px;
        border: 1px solid rgba(0,0,0,0.4);
        font-family: 'Open Sans', sans-serif;
    }
    #menu a {
        font-size: 13px;
        color: #404040;
        display: block;
        margin: 0;
        padding: 0;
        padding: 10px;
        text-decoration: none;
        border-bottom: 1px solid rgba(0,0,0,0.25);
        text-align: center;
    }
    #menu a:last-child {
        border: none;
    }
    #menu a:hover {
        background-color: #f8f8f8;
        color: #404040;
    }
    #menu a.active {
        background-color: #3887be;
        color: #ffffff;
    }
    #menu a.active:hover {
        background: #3074a4;
    }
</style>

<div id='map'></div>
<div id='menu'>
    <input id='sarahmlevine/cihs248is00aa95lylu5a7x1d' type='radio' name='rtoggle' value='satellite' checked='checked'>
    <label for='satellite'>satellite layer</label>
    <input id='sarahmlevine/cihvjue4p00h095lyyyyv2347' type='radio' name='rtoggle' value='basic'>
    <label for='basic'>streets</label>
</div>
<script>
mapboxgl.accessToken = 'pk.eyJ1Ijoic2FyYWhtbGV2aW5lIiwiYSI6IlAweXNYVEUifQ._dz0522LtBABUYyfqP503Q';
var map = new mapboxgl.Map({
    container: 'map',
    style: 'mapbox://styles/sarahmlevine/cihs248is00aa95lylu5a7x1d',
    zoom: 8.1,
    center: [-121.41, 37.91]
});
var layerList = document.getElementById('menu');
var inputs = layerList.getElementsByTagName('input');
function switchLayer(layer) {
    var layerId = layer.target.id;
    map.setStyle('mapbox://styles/' + layerId);
}
for (var i = 0; i < inputs.length; i++) {
    inputs[i].onclick = switchLayer;
}
map.on('style.load', function () {
    map.addSource('contours', {
        type: 'vector',
        url: 'mapbox://mapbox.mapbox-terrain-v2'
    });
    map.addLayer({
        'id': 'contours',
        'type': 'line',
        'source': 'contours',
        'source-layer': 'contour',
        'layout': {
            'line-join': 'round',
            'line-cap': 'round'
        },
        'paint': {
            'line-color': '#877b59',
            'line-width': 1
        }
    });
    map.addSource('hillshade', {
        type: 'vector',
        url: 'mapbox://mapbox.mapbox-terrain-v2'
    });
    map.addLayer({
        'id': 'hillshade',
        'type': 'line',
        'source': 'hillshade',
        'source-layer': 'hillshade',
        'layout': {
            'line-join': 'round',
            'line-cap': 'round'
        },
        'paint': {
            'line-color:': '#877b59',
            'line-width': 1,
            'line-opacity': 0.6,
        }
    });
});
addLayer('Contours', 'contours');
addLayer('Hillshade', 'hillshade');
function addLayer(name, id) {
    var link = document.createElement('a');
    link.href = '#';
    link.className = 'active';
    link.textContent = name;
    link.onclick = function (e) {
        e.preventDefault();
        e.stopPropagation();
        var visibility = map.getLayoutProperty(id, 'visibility');
        if (visibility === 'visible') {
            map.setLayoutProperty(id, 'visibility', 'none');
            this.className = '';
        } else {
            this.className = 'active';
            map.setLayoutProperty(id, 'visibility', 'visible');
        }
    };
    var layers = document.getElementById('menu');
    layers.appendChild(link);
}
// Add zoom and rotation controls to the map.
map.addControl(new mapboxgl.Navigation());
</script>
</body>
</html>

San Francisco Tree Census

I mapped all street trees in San Francisco as of April 26, 2015 recorded by Department of Public Works. Shades of green represent trees grouped by genus (legend below).

Sadly, Mapbox no longer supports the classic styles on which this map was built, so I’ve taken down what used to be an interactive map. Screen captures of the project, as it used to exist, are below.

(Street trees set excludes parks, including Golden Gate and Presidio.) Data from SF Open Data. Map created with Tilemill and Mapbox Studio. See the code.

LEGEND

Acacia
Maple (acer)
Chestnut (Aesculus)
Willow (Agonis)
Pine (Araucaria)
Birch (Betula)
Palm (Brahea)
Bottlebrush (Callistemon)
Hornbeam (Carpinus)
Beefwood (Casurina)
Cedar (Cedrus)
Hackberry (Celtis)
Gum (Corymbia)
Hawthorn (Crataegus)
Carrotwood (Cupaniopsis)
Cypress (Cupressus)
Bush (Dodonaea)
Dragon Tree (Dracaena)
Loquat (Eriobotrya)
Eucalyptus
Beech (Fagus)
Fig (Ficus)
Ash (Fraxinus)
Australian Willow (Geijera)
Gingko
Locust (Gleditsia)
Silk Oak (Grevillea)
Urchin/Hakea Tree (Hakea)
Sweet Shade (Hymenosporum)
Holly (Ilex)
Jacaranda
Juniper (Juniperus)
Laurel (Laurus)
Tea Tree (Leptospermum)
Sweet Gum (Liquidambar)
Magnolia
Crabapple (Malus)
Maleleuca
Olive (Olea europaea)
Cherry (Prunus)
Pear (Pyrus)
Oak (Quercus)
Elm (Ulmus)
Hawthorn (Rhaphiolepis)
Fan Palm (Washingtonia)
Yew (Taxus)