Mapping Race, Crime, and District Attorney Elections in NYC

I've been too swamped with law school to post anything new for a while now, but the past few weeks I've been working on a series of maps for Professor Issa Kohler-Hausmann. Her new book, Misdemeanorland, looks at expanded policing for minor offenses like misdemeanors and violations. In order to get a better sense of how crime and people are distributed across the city, and how that relates to voting behavior for District Attorney elections, I put together some maps of race and ethnicity, misdemeanors and felonies, and voting in DA-elections. You should also check out the other maps and charts that Issa had made, which track campaign financing and theft-of-services violations (like jumping a turnstile). You can see them all on her companion website for the book.

The one technical aspect of this that was a bit tricky was working with the election and population data. Election information is stored by the Board of Elections at a unit called the election district. Population estimates, on the other hand, come from the census and are stored in different aggregate units like census tracts and census block groups. I came up with a simple methodology for assigning population counts to election districts, in order to create voting maps that are normalized by population. The methodology requires the assumption that population is evenly distributed geographically within each census tract, while is obviously faulty. There are lots of ways to improve this - perhaps by adding zoning and land use layers to the maps and weighting population more heavily in more residential areas. For now, you can read about the methodology I implemented for the maps posted here. 

Race/Ethnicity and Voting in District Attorney Elections

Misdemeanors, Felonies, and Race/Ethnicity

Mines and Mapbox GL JS

The new Mapbox GL JS is unreal. I made a quick and sloppy map to try out some of the new features. I grabbed a dataset of mines in the US from MSHA's website. I loaded it up into Mapbox and created two styles: satellite imagery and streets. I took some code from their GL JS how-to's and threw it together. My Frankencode is below. Side note: JavaScript is hard. I put in some code to toggle between the two base layers, and to add two more optional layers for hillshade and contours. 

Issues to fix and things to improve in the next version: The dataset was HUGE. I had to limit to zoom levels to keep the size reasonable. You'll notice that if you zoom out too much, the data disappears. I might need to pay for Mapbox to make this work... Also there are two attributions at the bottom of the map for OSM and Mapbox. I do love OSM enough to thank it twice, but I think this has to do with two styles being loaded in. Another thing to investigate with more time.

Cool features: Hold shift and use the arrow keys to fly around. Note how place labels stay horizontal while you spin the Earth as if you stuck a pin in it first. 

Thanks, Mapbox. Here's the code I embedded above.

<html>
<head>
    <meta charset='utf-8' />
    <meta name='viewport' content='initial-scale=1,maximum-scale=1,user-scalable=no' />
    <script src='https://api.tiles.mapbox.com/mapbox-gl-js/v0.12.0/mapbox-gl.js'></script>
    <link href='https://api.tiles.mapbox.com/mapbox-gl-js/v0.12.0/mapbox-gl.css' rel='stylesheet' />
    <style>
        body { margin:0; padding:0; }
        #map { position:absolute; top:0; bottom:0; width:100%; }
    </style>
</head>
<body>

<style>
    #menu {
        background: #fff;
        position: absolute;
        z-index: 1;
        top: 10px;
        right: 10px;
        border-radius: 3px;
        width: 120px;
        border: 1px solid rgba(0,0,0,0.4);
        font-family: 'Open Sans', sans-serif;
    }
    #menu a {
        font-size: 13px;
        color: #404040;
        display: block;
        margin: 0;
        padding: 0;
        padding: 10px;
        text-decoration: none;
        border-bottom: 1px solid rgba(0,0,0,0.25);
        text-align: center;
    }
    #menu a:last-child {
        border: none;
    }
    #menu a:hover {
        background-color: #f8f8f8;
        color: #404040;
    }
    #menu a.active {
        background-color: #3887be;
        color: #ffffff;
    }
    #menu a.active:hover {
        background: #3074a4;
    }
</style>

<div id='map'></div>
<div id='menu'>
    <input id='sarahmlevine/cihs248is00aa95lylu5a7x1d' type='radio' name='rtoggle' value='satellite' checked='checked'>
    <label for='satellite'>satellite layer</label>
    <input id='sarahmlevine/cihvjue4p00h095lyyyyv2347' type='radio' name='rtoggle' value='basic'>
    <label for='basic'>streets</label>
</div>
<script>
mapboxgl.accessToken = 'pk.eyJ1Ijoic2FyYWhtbGV2aW5lIiwiYSI6IlAweXNYVEUifQ._dz0522LtBABUYyfqP503Q';
var map = new mapboxgl.Map({
    container: 'map',
    style: 'mapbox://styles/sarahmlevine/cihs248is00aa95lylu5a7x1d',
    zoom: 8.1,
    center: [-121.41, 37.91]
});
var layerList = document.getElementById('menu');
var inputs = layerList.getElementsByTagName('input');
function switchLayer(layer) {
    var layerId = layer.target.id;
    map.setStyle('mapbox://styles/' + layerId);
}
for (var i = 0; i < inputs.length; i++) {
    inputs[i].onclick = switchLayer;
}
map.on('style.load', function () {
    map.addSource('contours', {
        type: 'vector',
        url: 'mapbox://mapbox.mapbox-terrain-v2'
    });
    map.addLayer({
        'id': 'contours',
        'type': 'line',
        'source': 'contours',
        'source-layer': 'contour',
        'layout': {
            'line-join': 'round',
            'line-cap': 'round'
        },
        'paint': {
            'line-color': '#877b59',
            'line-width': 1
        }
    });
    map.addSource('hillshade', {
        type: 'vector',
        url: 'mapbox://mapbox.mapbox-terrain-v2'
    });
    map.addLayer({
        'id': 'hillshade',
        'type': 'line',
        'source': 'hillshade',
        'source-layer': 'hillshade',
        'layout': {
            'line-join': 'round',
            'line-cap': 'round'
        },
        'paint': {
            'line-color:': '#877b59',
            'line-width': 1,
            'line-opacity': 0.6,
        }
    });
});
addLayer('Contours', 'contours');
addLayer('Hillshade', 'hillshade');
function addLayer(name, id) {
    var link = document.createElement('a');
    link.href = '#';
    link.className = 'active';
    link.textContent = name;
    link.onclick = function (e) {
        e.preventDefault();
        e.stopPropagation();
        var visibility = map.getLayoutProperty(id, 'visibility');
        if (visibility === 'visible') {
            map.setLayoutProperty(id, 'visibility', 'none');
            this.className = '';
        } else {
            this.className = 'active';
            map.setLayoutProperty(id, 'visibility', 'visible');
        }
    };
    var layers = document.getElementById('menu');
    layers.appendChild(link);
}
// Add zoom and rotation controls to the map.
map.addControl(new mapboxgl.Navigation());
</script>
</body>
</html>

San Francisco Tree Census

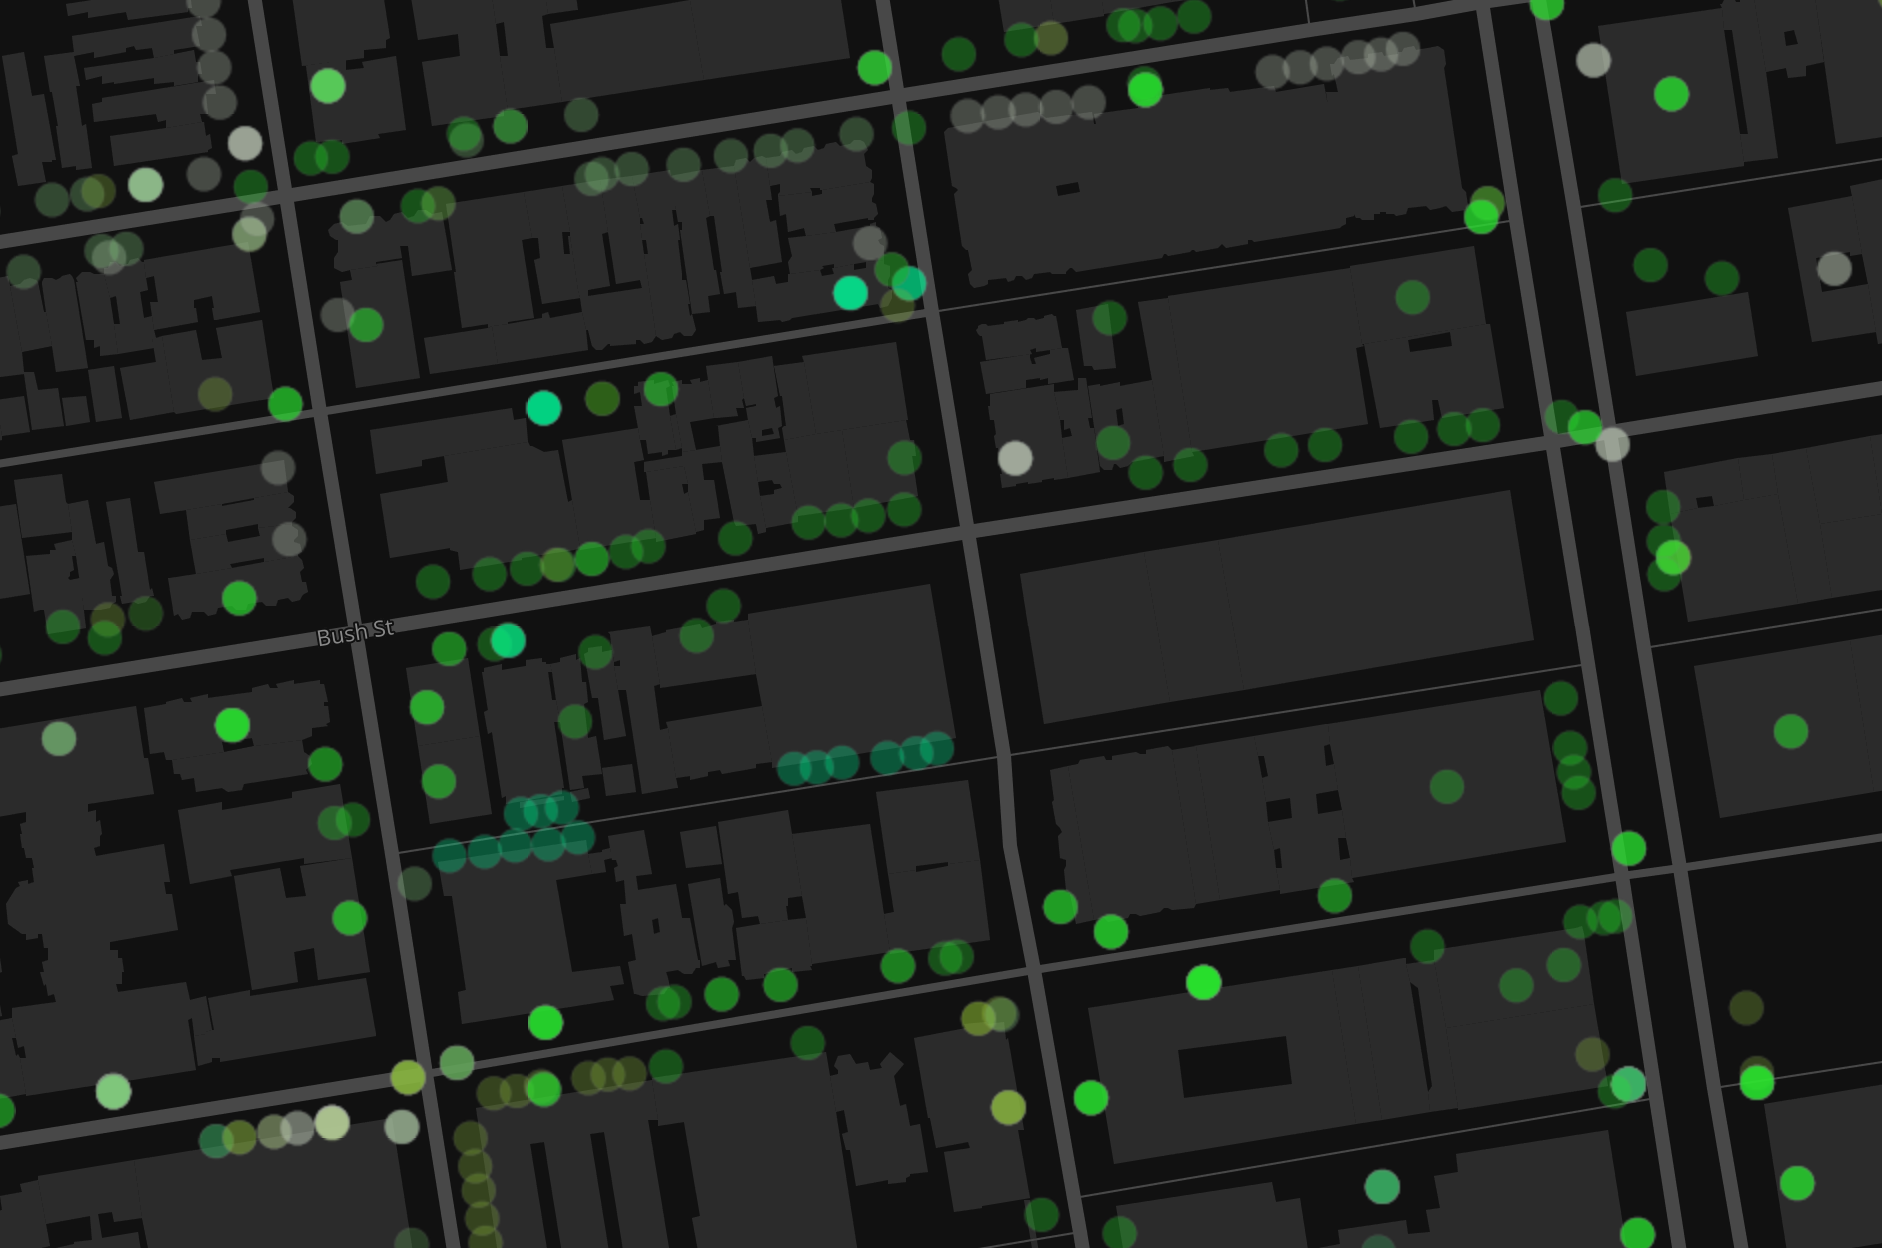
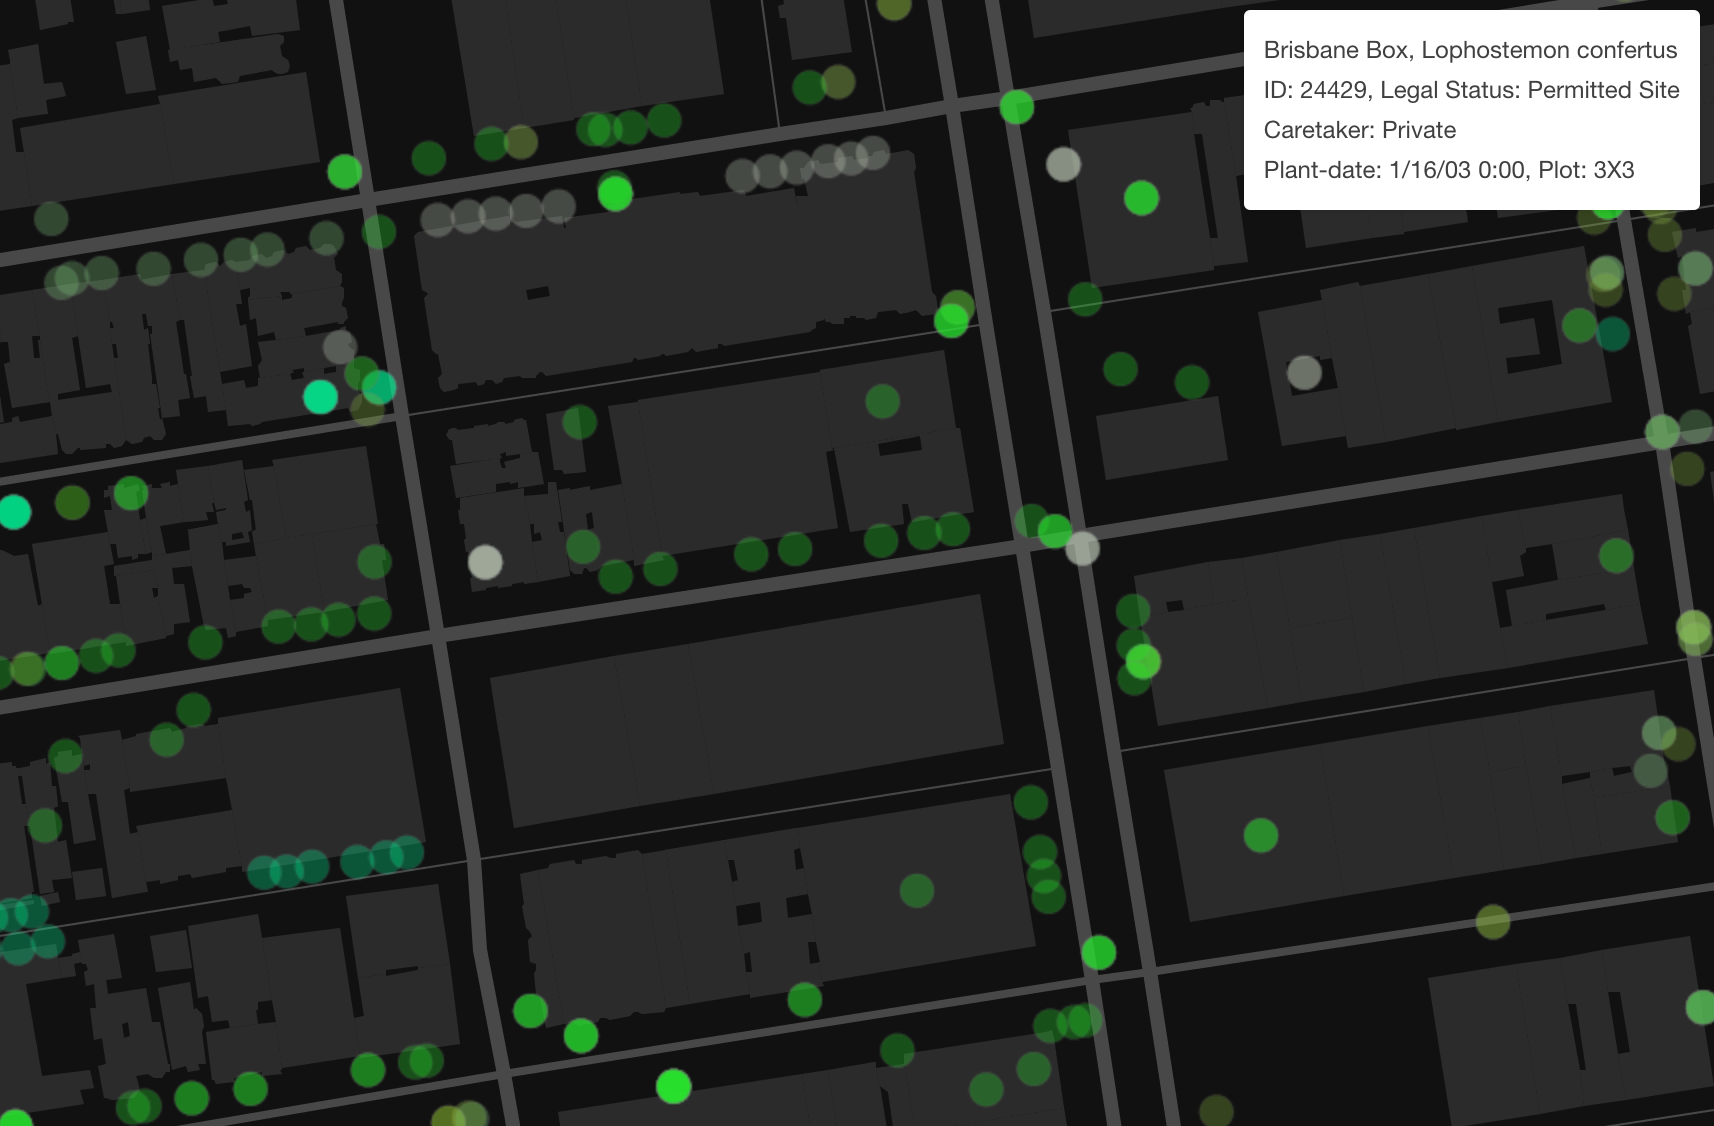
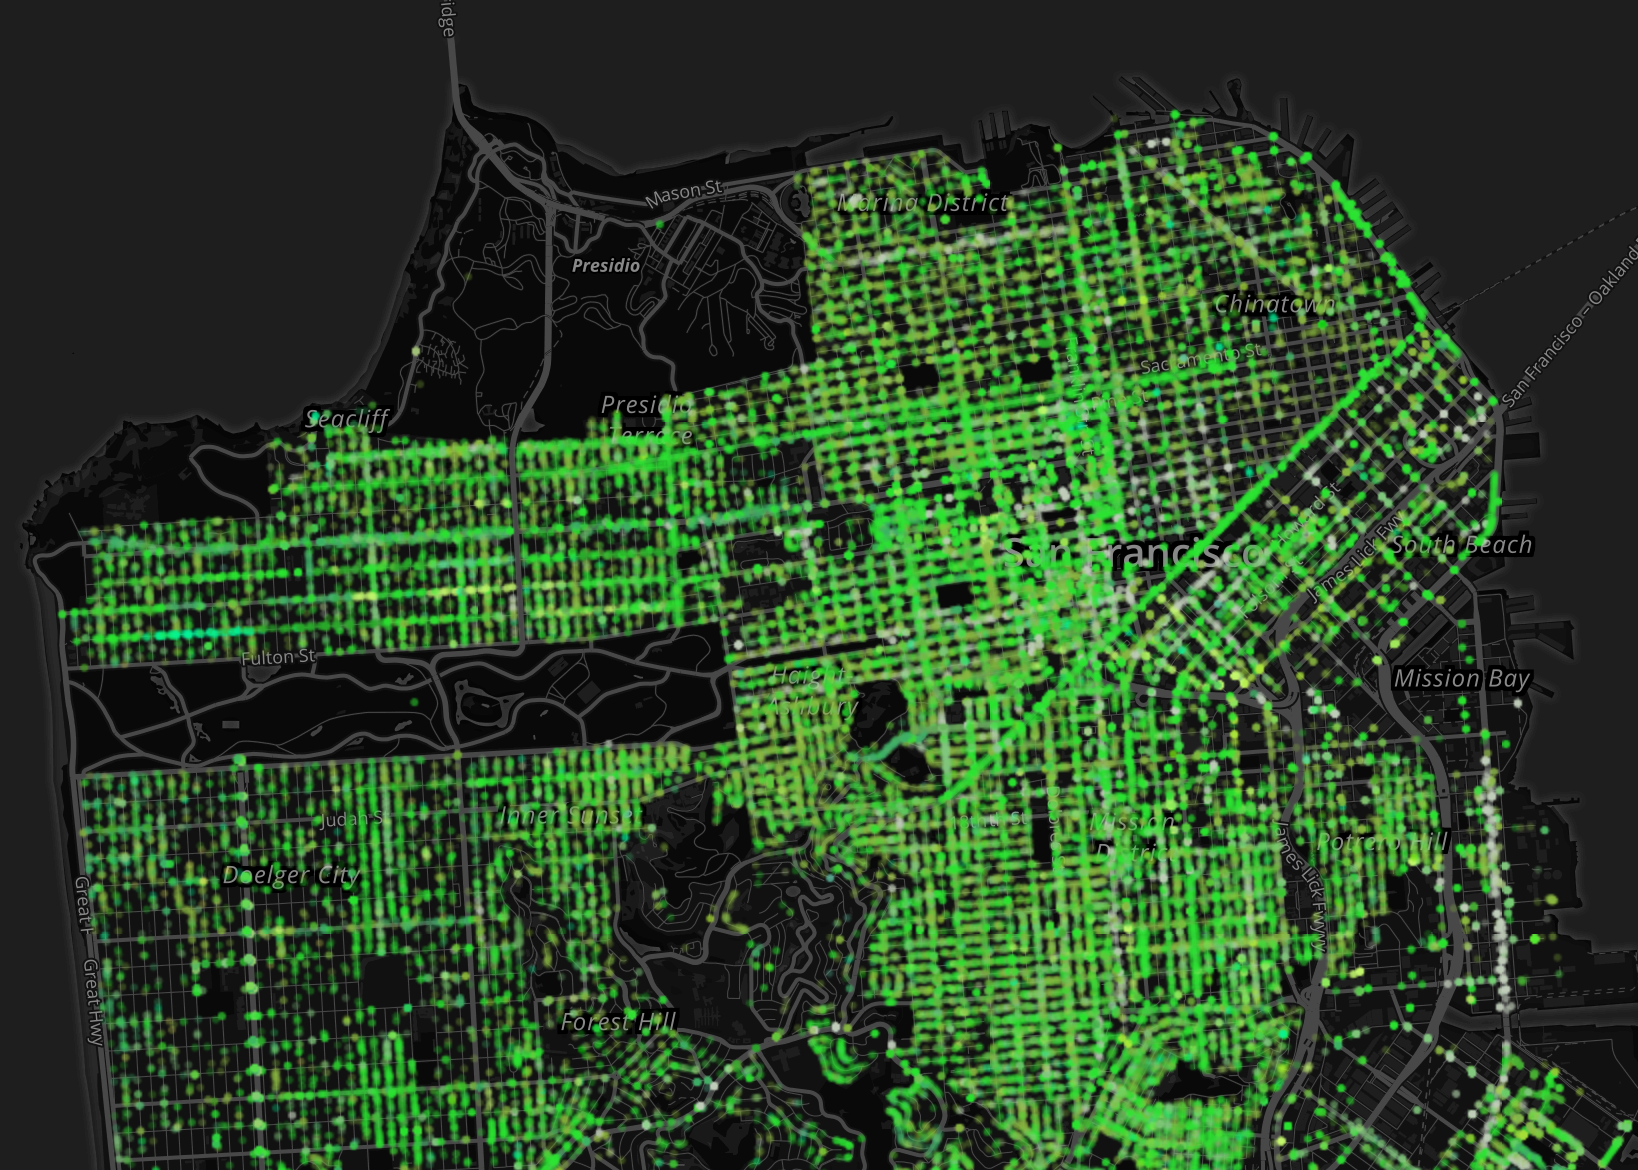
I mapped all street trees in San Francisco as of April 26, 2015 recorded by Department of Public Works. Shades of green represent trees grouped by genus (legend below).

Sadly, Mapbox no longer supports the classic styles on which this map was built, so I’ve taken down what used to be an interactive map. Screen captures of the project, as it used to exist, are below.

(Street trees set excludes parks, including Golden Gate and Presidio.) Data from SF Open Data. Map created with Tilemill and Mapbox Studio. See the code.

LEGEND

Acacia
Maple (acer)
Chestnut (Aesculus)
Willow (Agonis)
Pine (Araucaria)
Birch (Betula)
Palm (Brahea)
Bottlebrush (Callistemon)
Hornbeam (Carpinus)
Beefwood (Casurina)
Cedar (Cedrus)
Hackberry (Celtis)
Gum (Corymbia)
Hawthorn (Crataegus)
Carrotwood (Cupaniopsis)
Cypress (Cupressus)
Bush (Dodonaea)
Dragon Tree (Dracaena)
Loquat (Eriobotrya)
Eucalyptus
Beech (Fagus)
Fig (Ficus)
Ash (Fraxinus)
Australian Willow (Geijera)
Gingko
Locust (Gleditsia)
Silk Oak (Grevillea)
Urchin/Hakea Tree (Hakea)
Sweet Shade (Hymenosporum)
Holly (Ilex)
Jacaranda
Juniper (Juniperus)
Laurel (Laurus)
Tea Tree (Leptospermum)
Sweet Gum (Liquidambar)
Magnolia
Crabapple (Malus)
Maleleuca
Olive (Olea europaea)
Cherry (Prunus)
Pear (Pyrus)
Oak (Quercus)
Elm (Ulmus)
Hawthorn (Rhaphiolepis)
Fan Palm (Washingtonia)
Yew (Taxus)