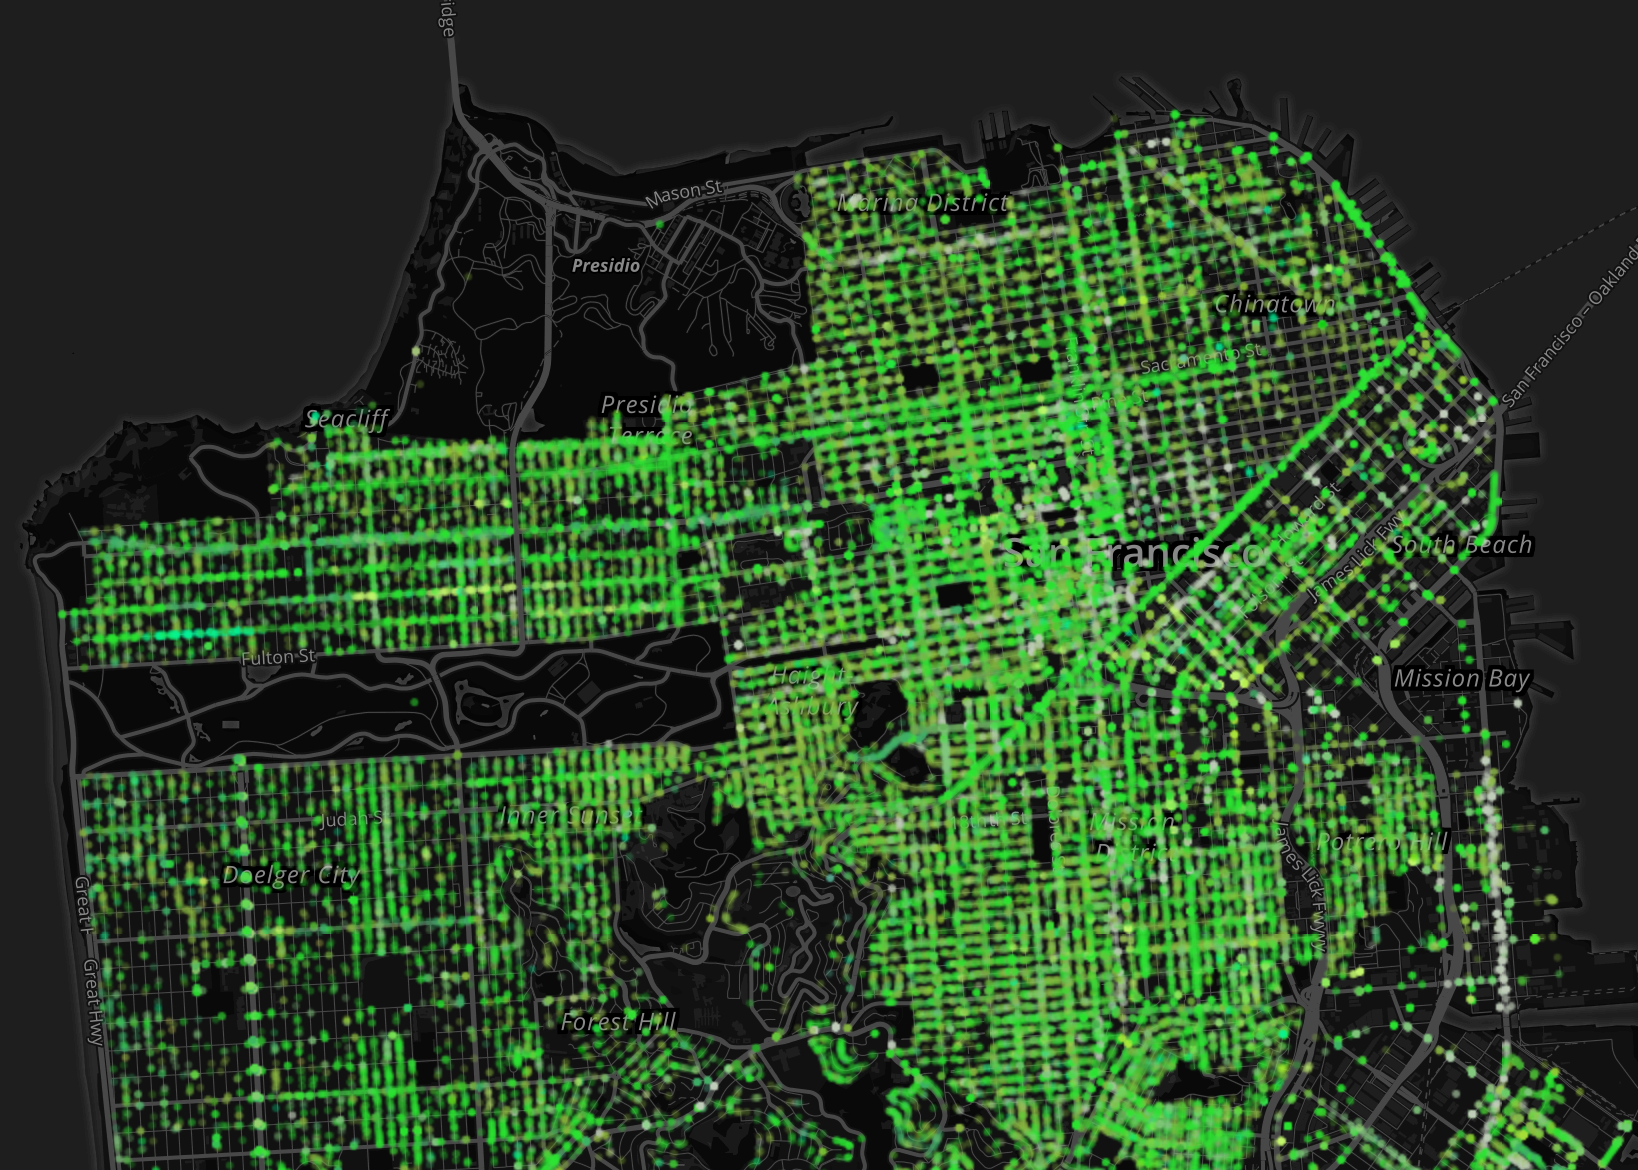
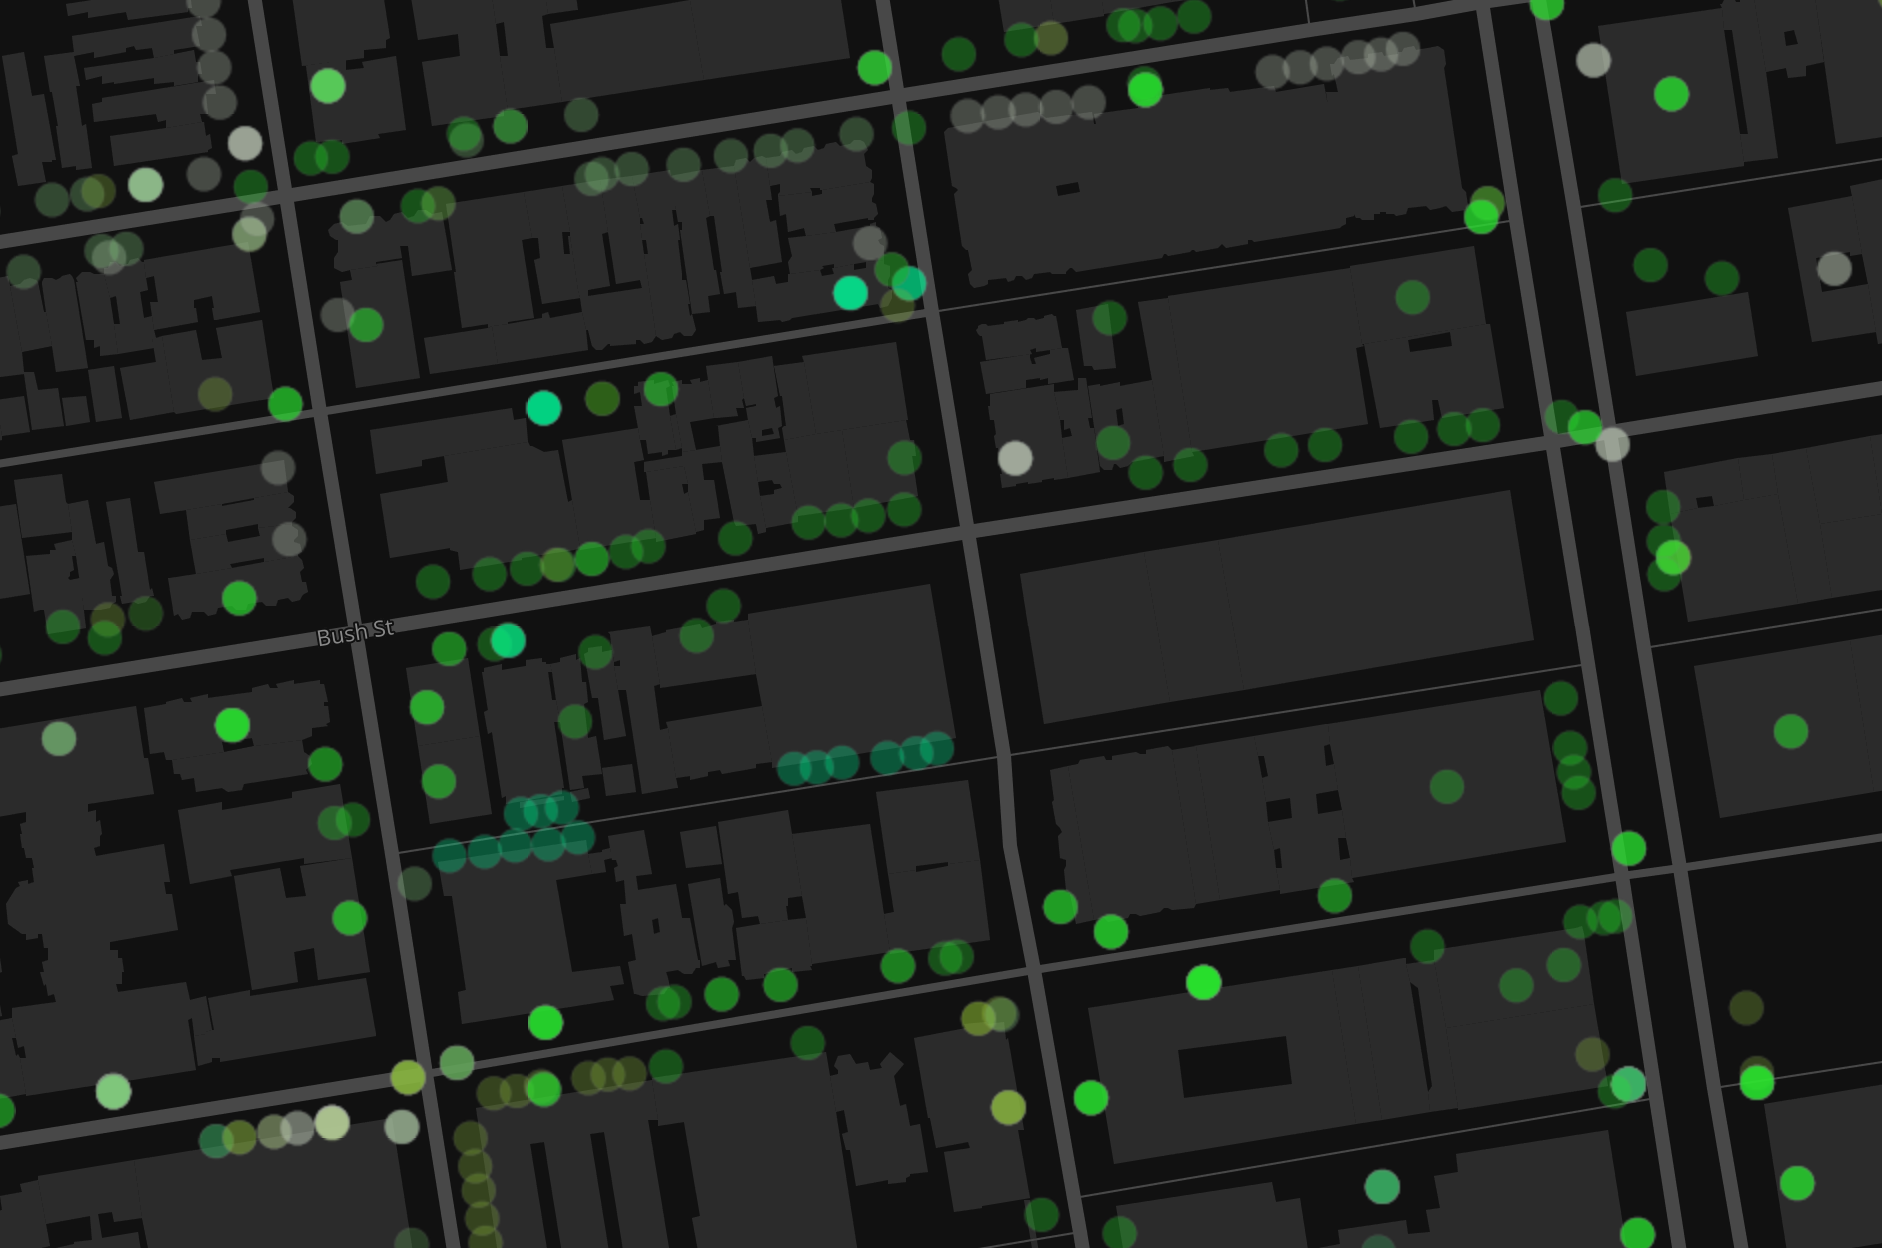
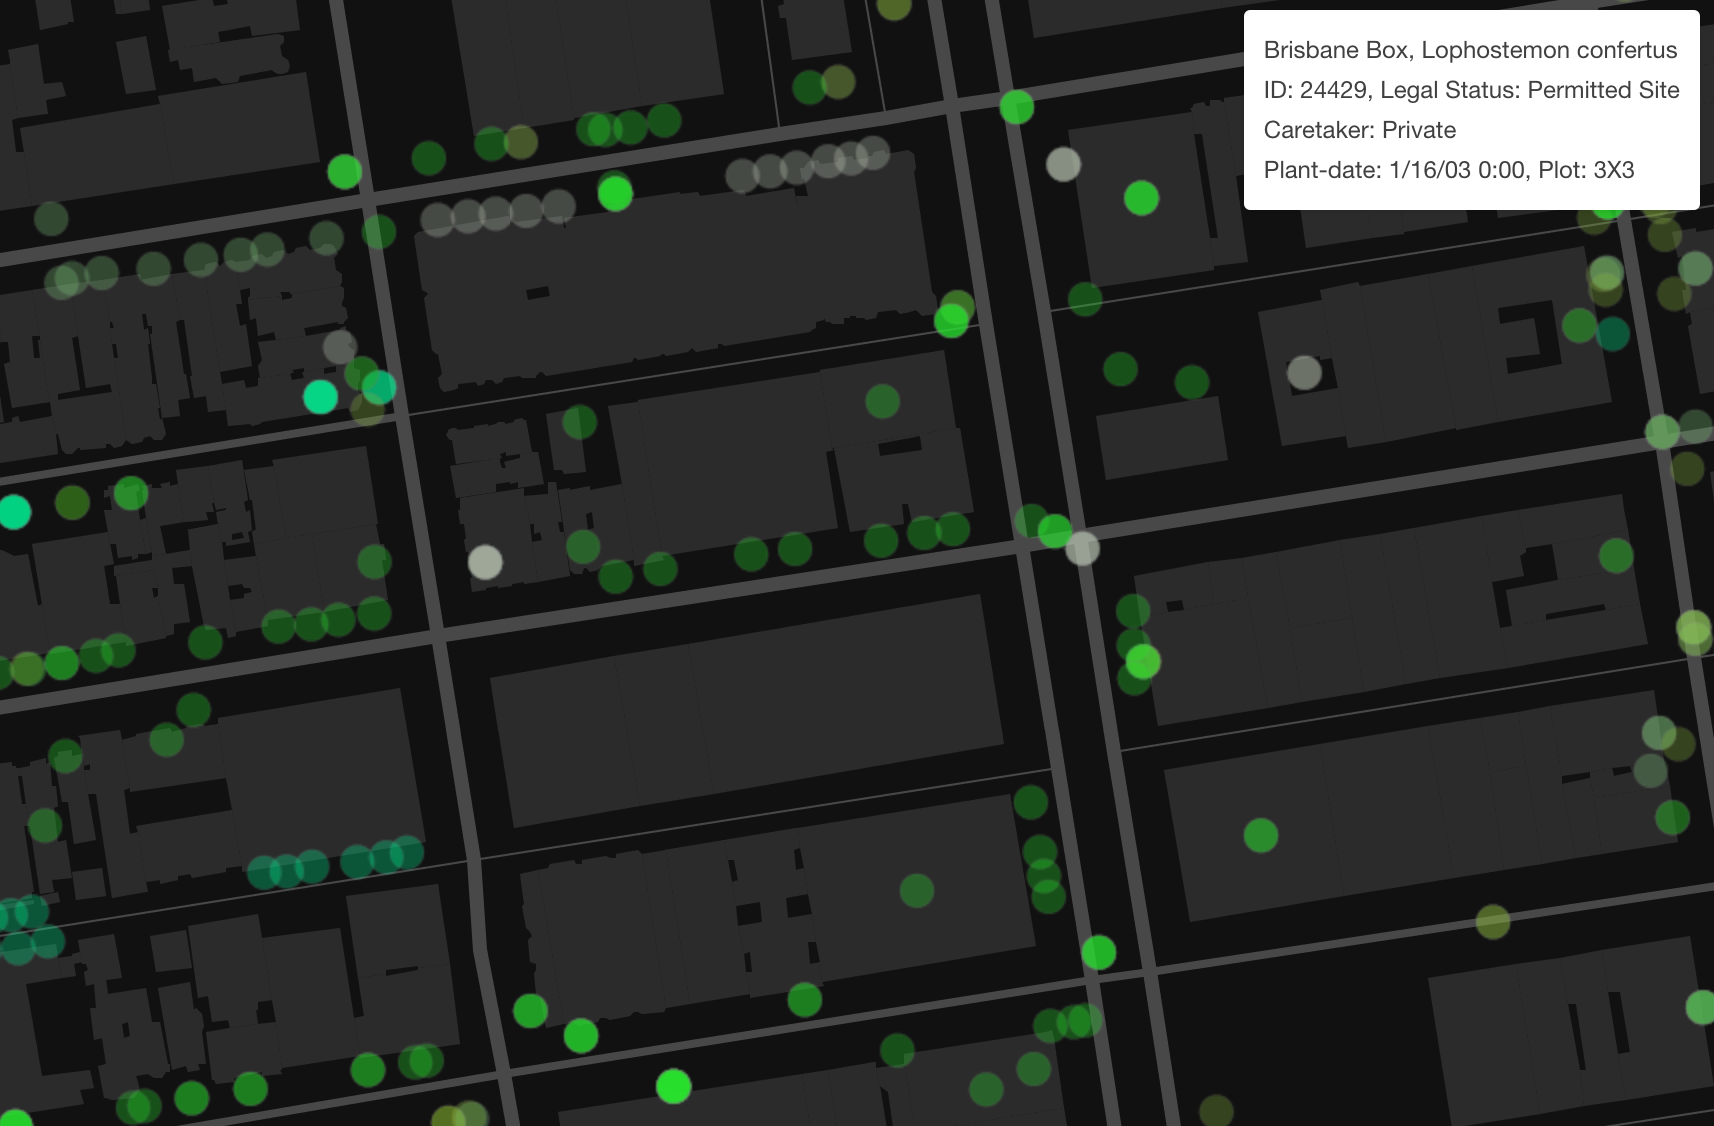
San Francisco Tree Census

I mapped all street trees in San Francisco as of April 26, 2015 recorded by Department of Public Works. Shades of green represent trees grouped by genus (legend below).

Sadly, Mapbox no longer supports the classic styles on which this map was built, so I’ve taken down what used to be an interactive map. Screen captures of the project, as it used to exist, are below.

(Street trees set excludes parks, including Golden Gate and Presidio.) Data from SF Open Data. Map created with Tilemill and Mapbox Studio. See the code.

LEGEND

Acacia
Maple (acer)
Chestnut (Aesculus)
Willow (Agonis)
Pine (Araucaria)
Birch (Betula)
Palm (Brahea)
Bottlebrush (Callistemon)
Hornbeam (Carpinus)
Beefwood (Casurina)
Cedar (Cedrus)
Hackberry (Celtis)
Gum (Corymbia)
Hawthorn (Crataegus)
Carrotwood (Cupaniopsis)
Cypress (Cupressus)
Bush (Dodonaea)
Dragon Tree (Dracaena)
Loquat (Eriobotrya)
Eucalyptus
Beech (Fagus)
Fig (Ficus)
Ash (Fraxinus)
Australian Willow (Geijera)
Gingko
Locust (Gleditsia)
Silk Oak (Grevillea)
Urchin/Hakea Tree (Hakea)
Sweet Shade (Hymenosporum)
Holly (Ilex)
Jacaranda
Juniper (Juniperus)
Laurel (Laurus)
Tea Tree (Leptospermum)
Sweet Gum (Liquidambar)
Magnolia
Crabapple (Malus)
Maleleuca
Olive (Olea europaea)
Cherry (Prunus)
Pear (Pyrus)
Oak (Quercus)
Elm (Ulmus)
Hawthorn (Rhaphiolepis)
Fan Palm (Washingtonia)
Yew (Taxus)

Clustering San Francisco Crime Data

I grabbed crimes from January 1, 2014 - Crime Incidents - Current Year - as a json and wrote a python script to use K-Means clustering to clean up and analyze the points. The clustering sorts the points around a centroid, so that every point is closer to that centroid than to any other. Crudely, it delineates clusters of points grouped around "hotspots." The map displays the generated centroids along with Police Districts and Neighborhoods.

Most reports in the city present crimes grouped by some other category: neighborhoods (orange) or police districts (green). Reporting crimes by natural groups of incidents reveals slightly more nuanced patterns.

For example, two of the crime "hotspots" that fall within the Tenderloin police district teeter on the border of the Southern police district and SOMA neighborhood. While crime reporting isolates Southern and SOMA crime, those incidents contribute (over 50%) to a crime pattern originating from the Tenderloin district. Additionally, the fourth largest hotspot, in Bayview (10288), compared to the largest, Tenderloin (18509), falls within the second largest police district (Bayview), whereas Tenderloin police district is the smallest of all. 

This is the first part of a larger series I'll be working on to evaluate the distribution of crime and police resources, as well as perceptions of crime and safety, in San Francisco.

See the code.

Three Months of Gun Violence in San Francisco

INCIDENTS
ROBBERY, ARMED WITH A GUN
: 47
ROBBERY ON THE STREET WITH A GUN: 45
AGGRAVATED ASSAULT WITH A GUN: 32
POSS OF FIREARM BY CONVICTED FELON/ADDICT/ALIEN: 31
POSS OF LOADED FIREARM: 31
CARRYING A CONCEALED WEAPON: 21
ATTEMPTED HOMICIDE WITH A GUN: 5
ATTEMPTED ROBBERY COMM. ESTABLISHMENT WITH A GUN: 2
ATTEMPTED ROBBERY ON THE STREET WITH A GUN: 5
ATTEMPTED ROBBERY RESIDENCE WITH A GUN: 2
ATTEMPTED ROBBERY WITH A GUN: 7
ATTEMPTED SUICIDE BY FIREARMS: 1
CARJACKING WITH A GUN: 4
CARRYING OF CONCEALED WEAPON BY CONVICTED FELON: 6
MAYHEM WITH A GUN: 1
ROBBERY OF A BANK WITH A GUN: 7
ROBBERY OF A CHAIN STORE WITH A GUN: 2
ROBBERY OF A COMMERCIAL ESTABLISHMENT WITH A GUN: 5
ROBBERY OF A RESIDENCE WITH A GUN: 3
ROBBERY OF A SERVICE STATION WITH A GUN: 3
SUICIDE BY FIREARMS: 1
TAMPERING WITH MARKS ON FIREARM: 1
TURNED IN GUN: 10
DAY OF WEEK STATS
Friday: 55
Sunday: 46
Wednesday: 40
Tuesday: 40
Thursday: 34
Saturday: 30

Monday: 27

All of the gun-related crime in San Francisco over the past three months, mapped. Scroll over incidents for incident numbers, dates, descriptions, and resolution. Data extracted from Open Data SF, Map: Crime Incidents - Previous Three Months. Created with MapBox and TileMill.

Want to help efforts to get guns off the streets of San Francisco? Consider donating to Gunbygun - a San Francisco non-profit that crowdfunds for buyback events. They removed $20,000 of firearms from San Francisco streets last summer alone.

Like Gunbygun on Facebook.
Learn more about them.
Donate $50 to take a gun off the street.


Mapping The Damage Done to Manhattan Streets in a Year

NYC DOT collects 311 complaints about roads. I animated the damage done over 2012 to visualize the beating that Manhattan streets take. It's no surprise that potholes are the biggest complaint, with practically one or more on every block. There is a scary number of "unsafe worksite" and "cave-in" (gah!?) reports.

This was a good project to experiment with the relative advantages of using a time slider to export to a movie versus building a GIF. The time slider works well but is fickle, and I find the enable time feature to be limiting. Some other features aren't as adaptable as I'd like them to be - for example, displaying the legend and identifying the best time increments. On the other hand, building the GIF is tedious. My computer is so slow with video that making GIFs was somehow faster.

What I had really hoped to do with this data was to visualize complaints as they happen throughout the year, and then have the points disappear as the complaints are addressed. This might give insight into which complaints and neighborhoods get the most and least attention. It became clear as I built the animation this way that the DOT system for reporting a complaint as "closed" is pretty arbitrary. The "closed" dates for each report were always close in time to some cluster of complaints, and stretched precisely a month apart, looking suspiciously like any given pile of complaints that might have accumulated on a desk over a month were all closed out before some analyst deadline.

All Upper Manhattan reported street complaints in 2012 every 19 days. All Lower Manhattan reported street complaints in 2012 every 19 days. Data from NYC Open Data 2012 311 complaints to the Department of Transportation.

 
UWS
 
 
LM