Mines and Mapbox GL JS

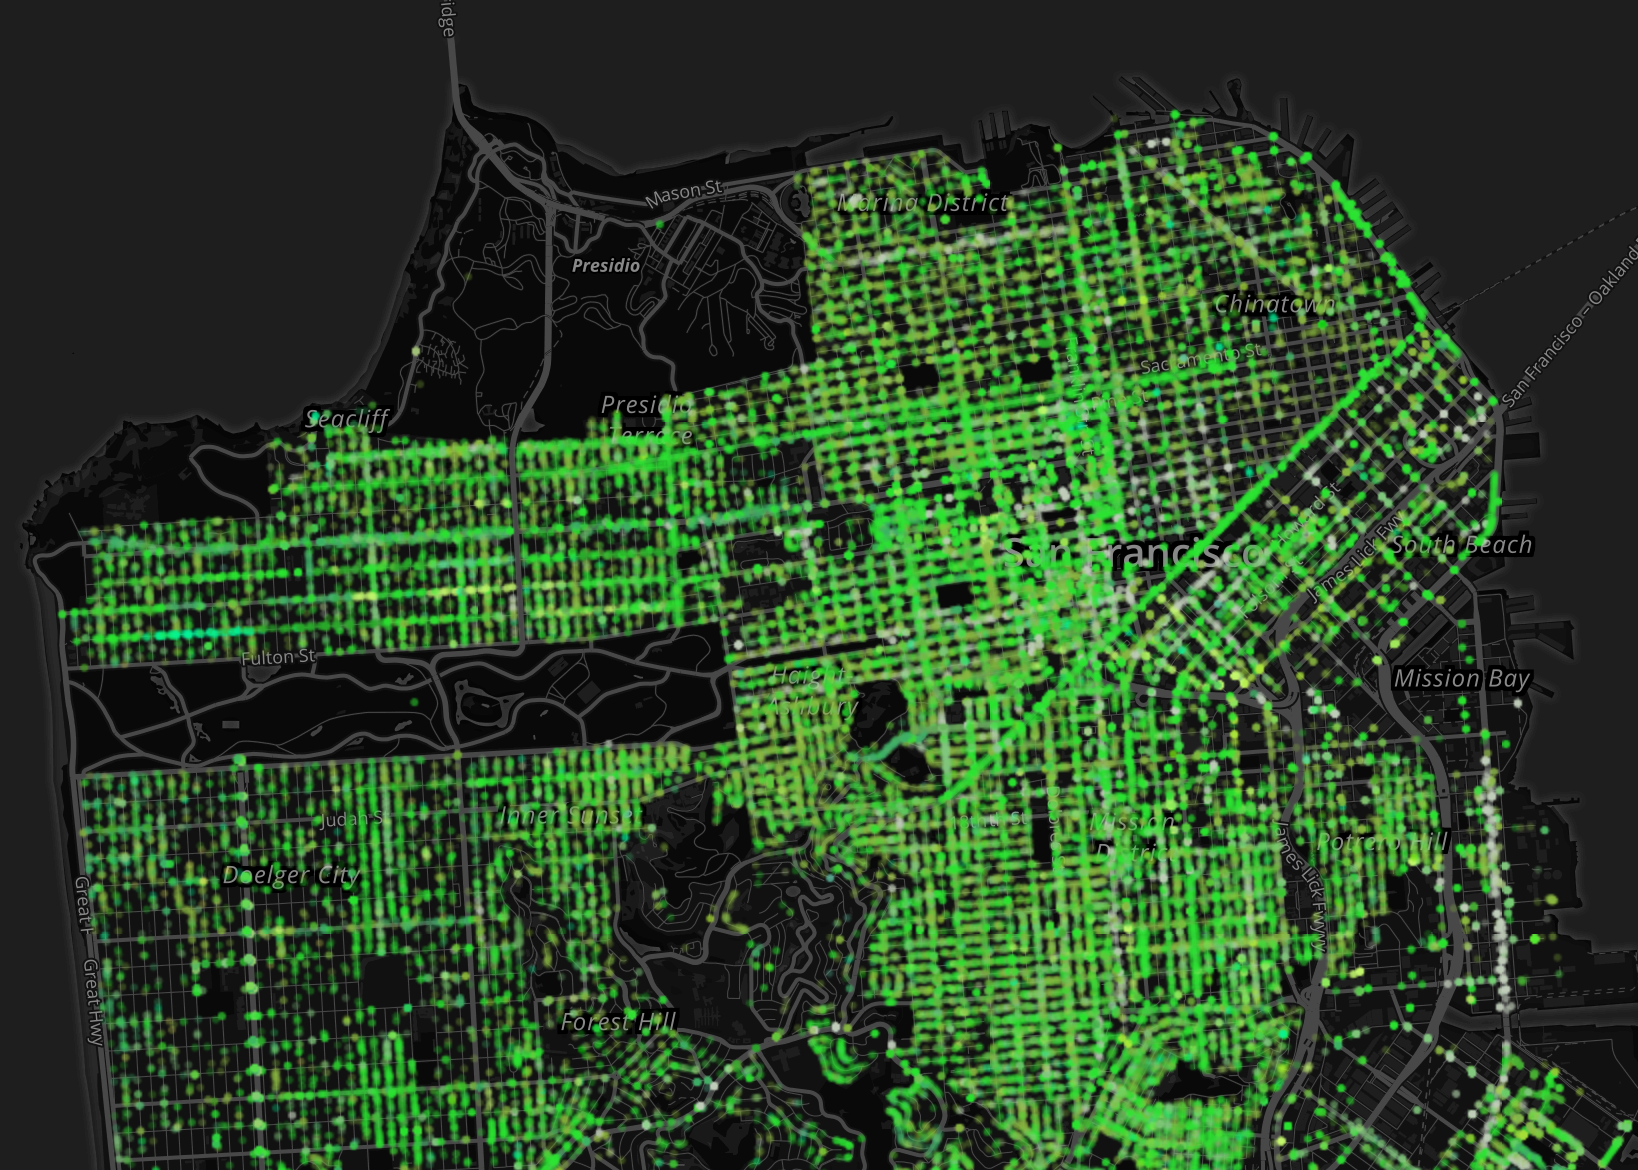
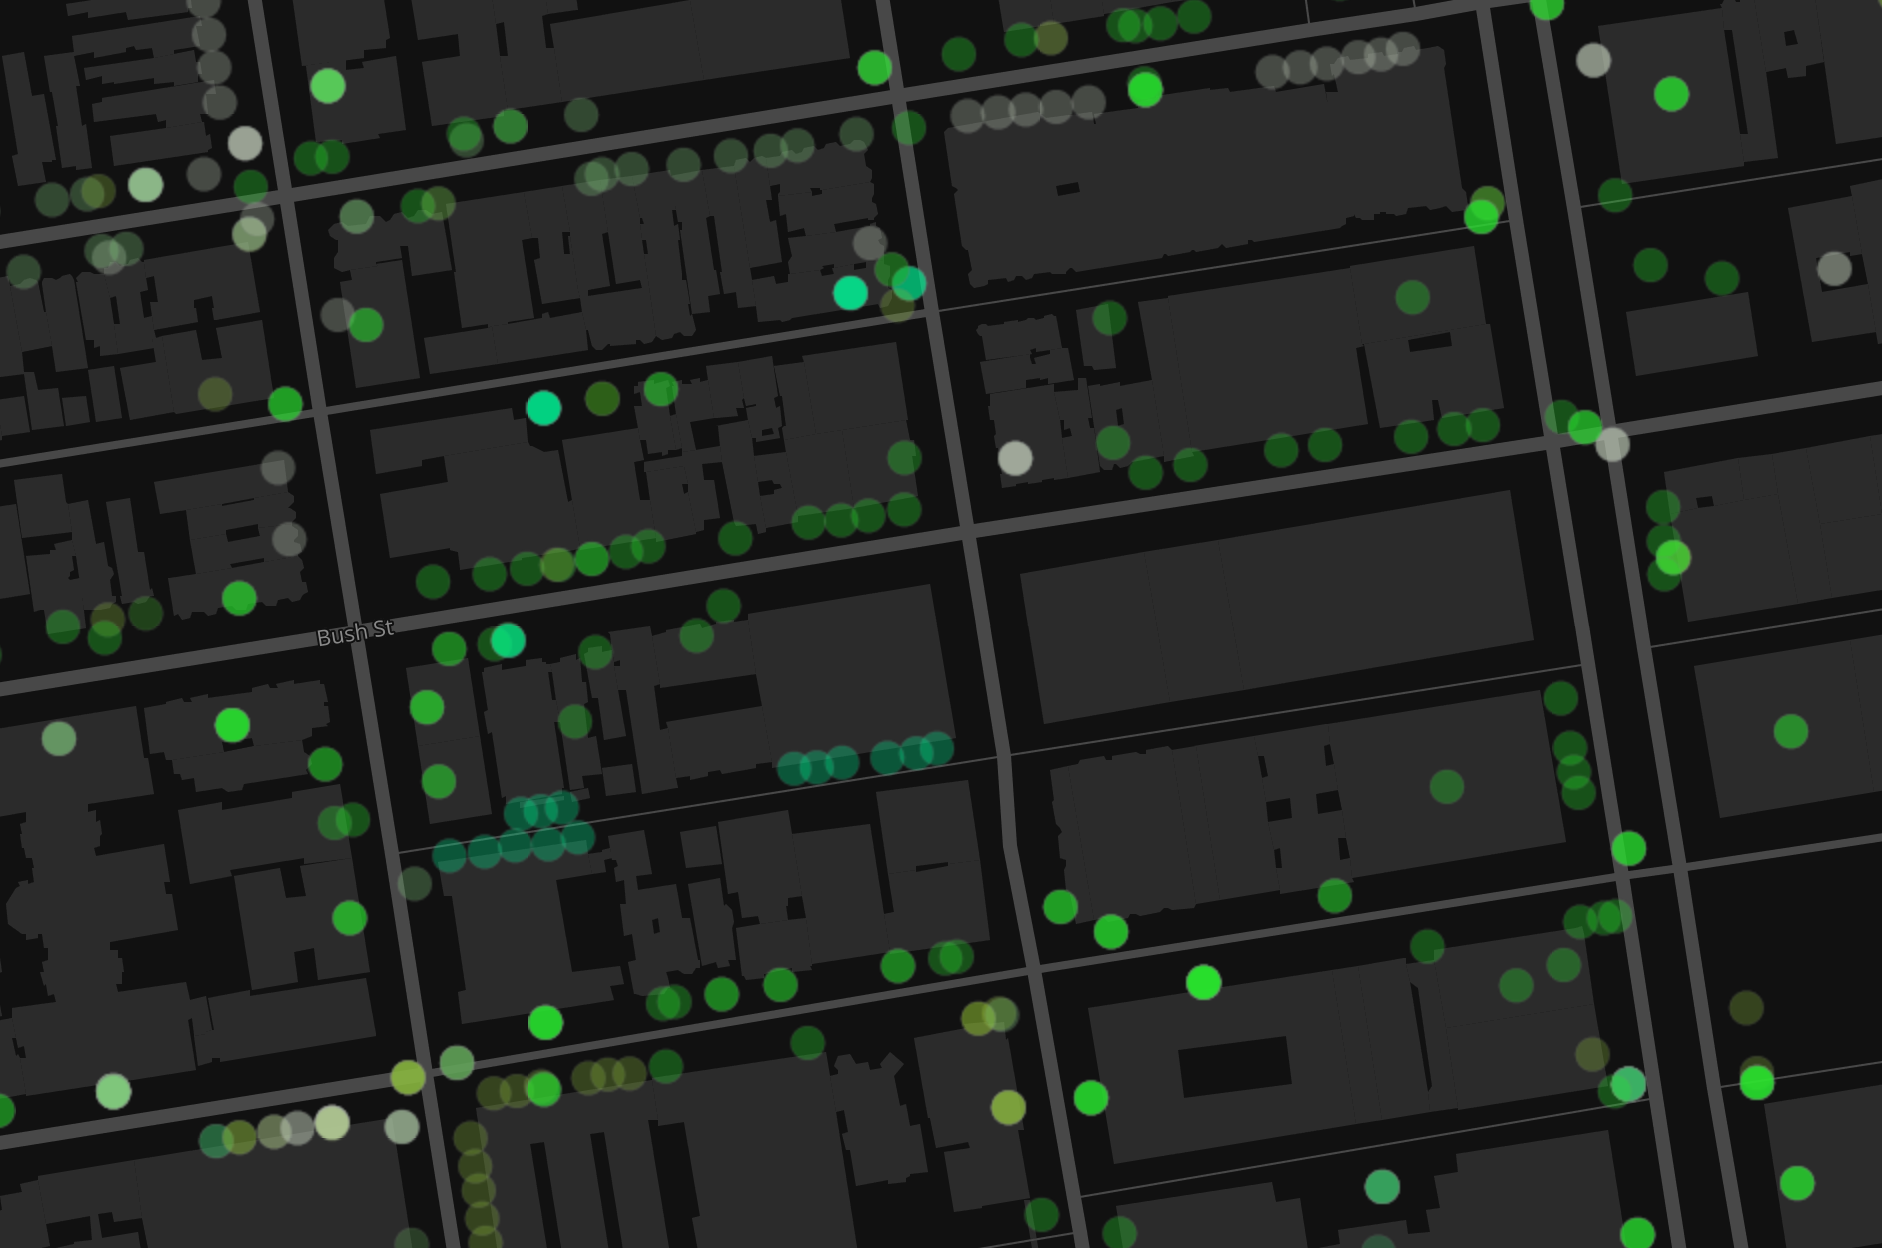
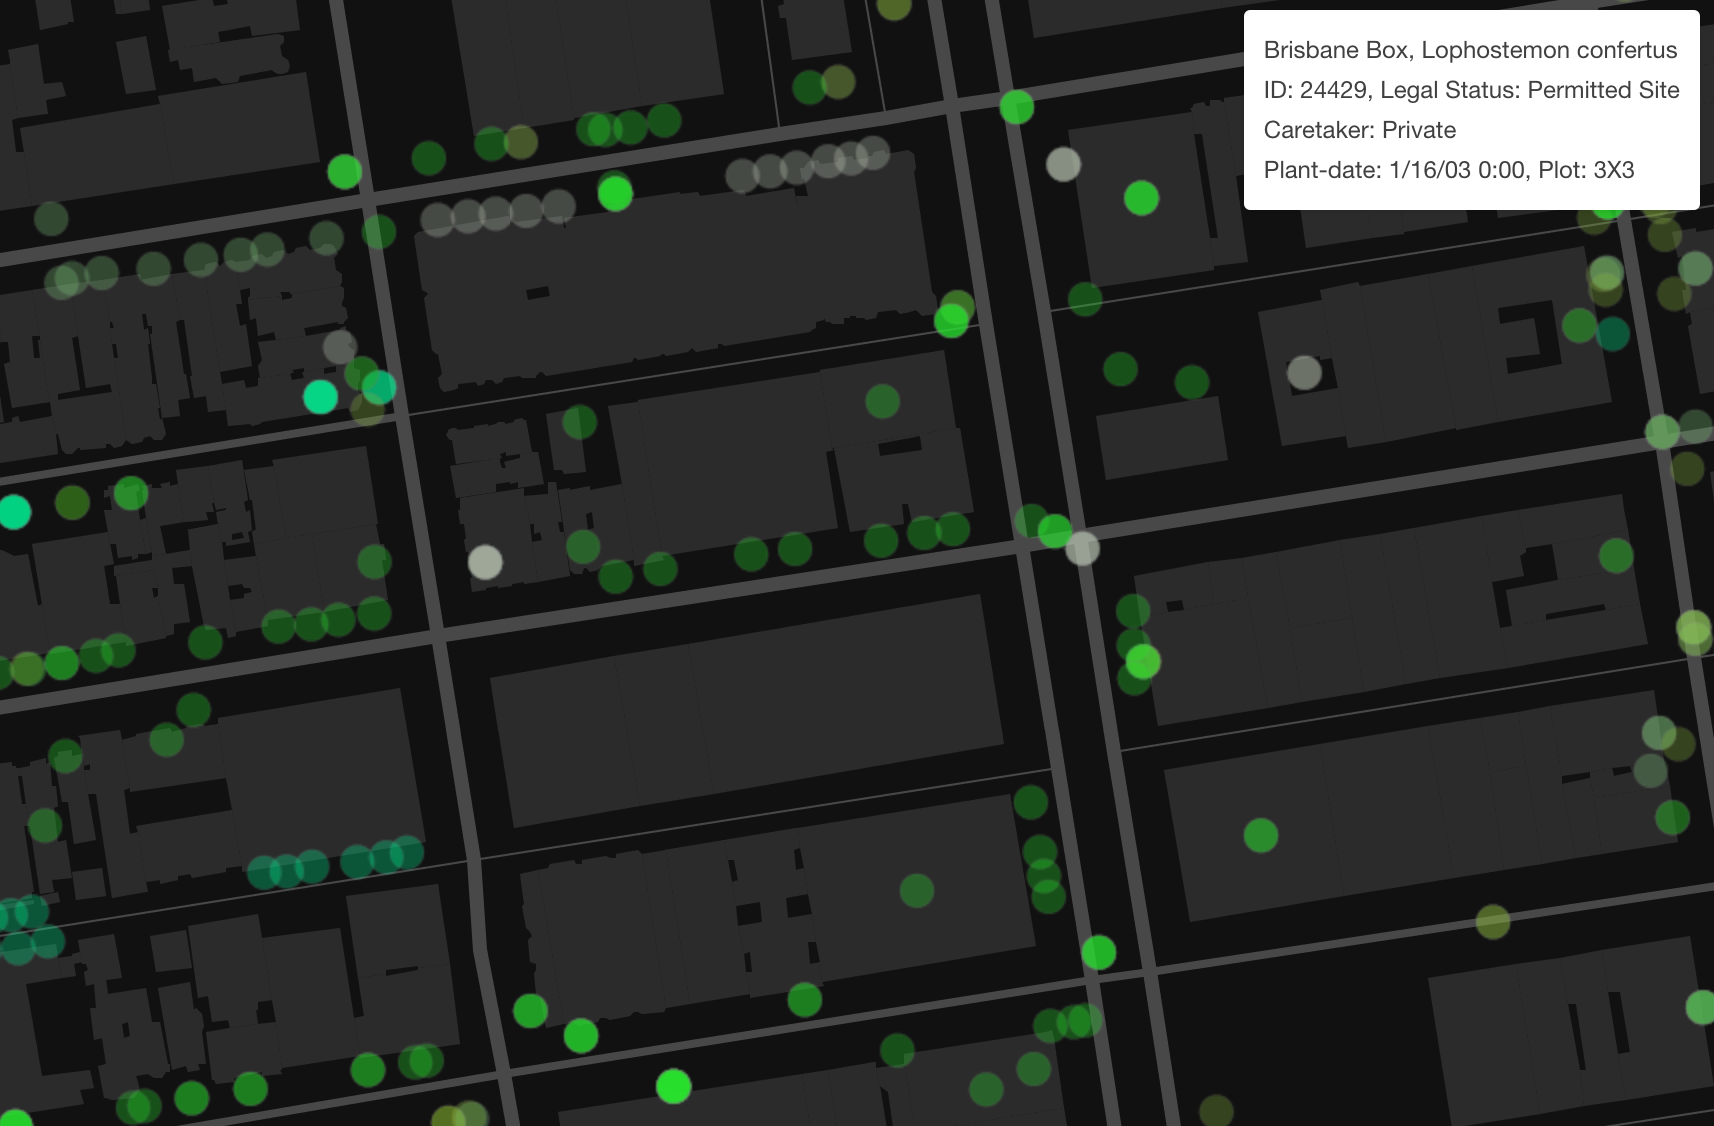
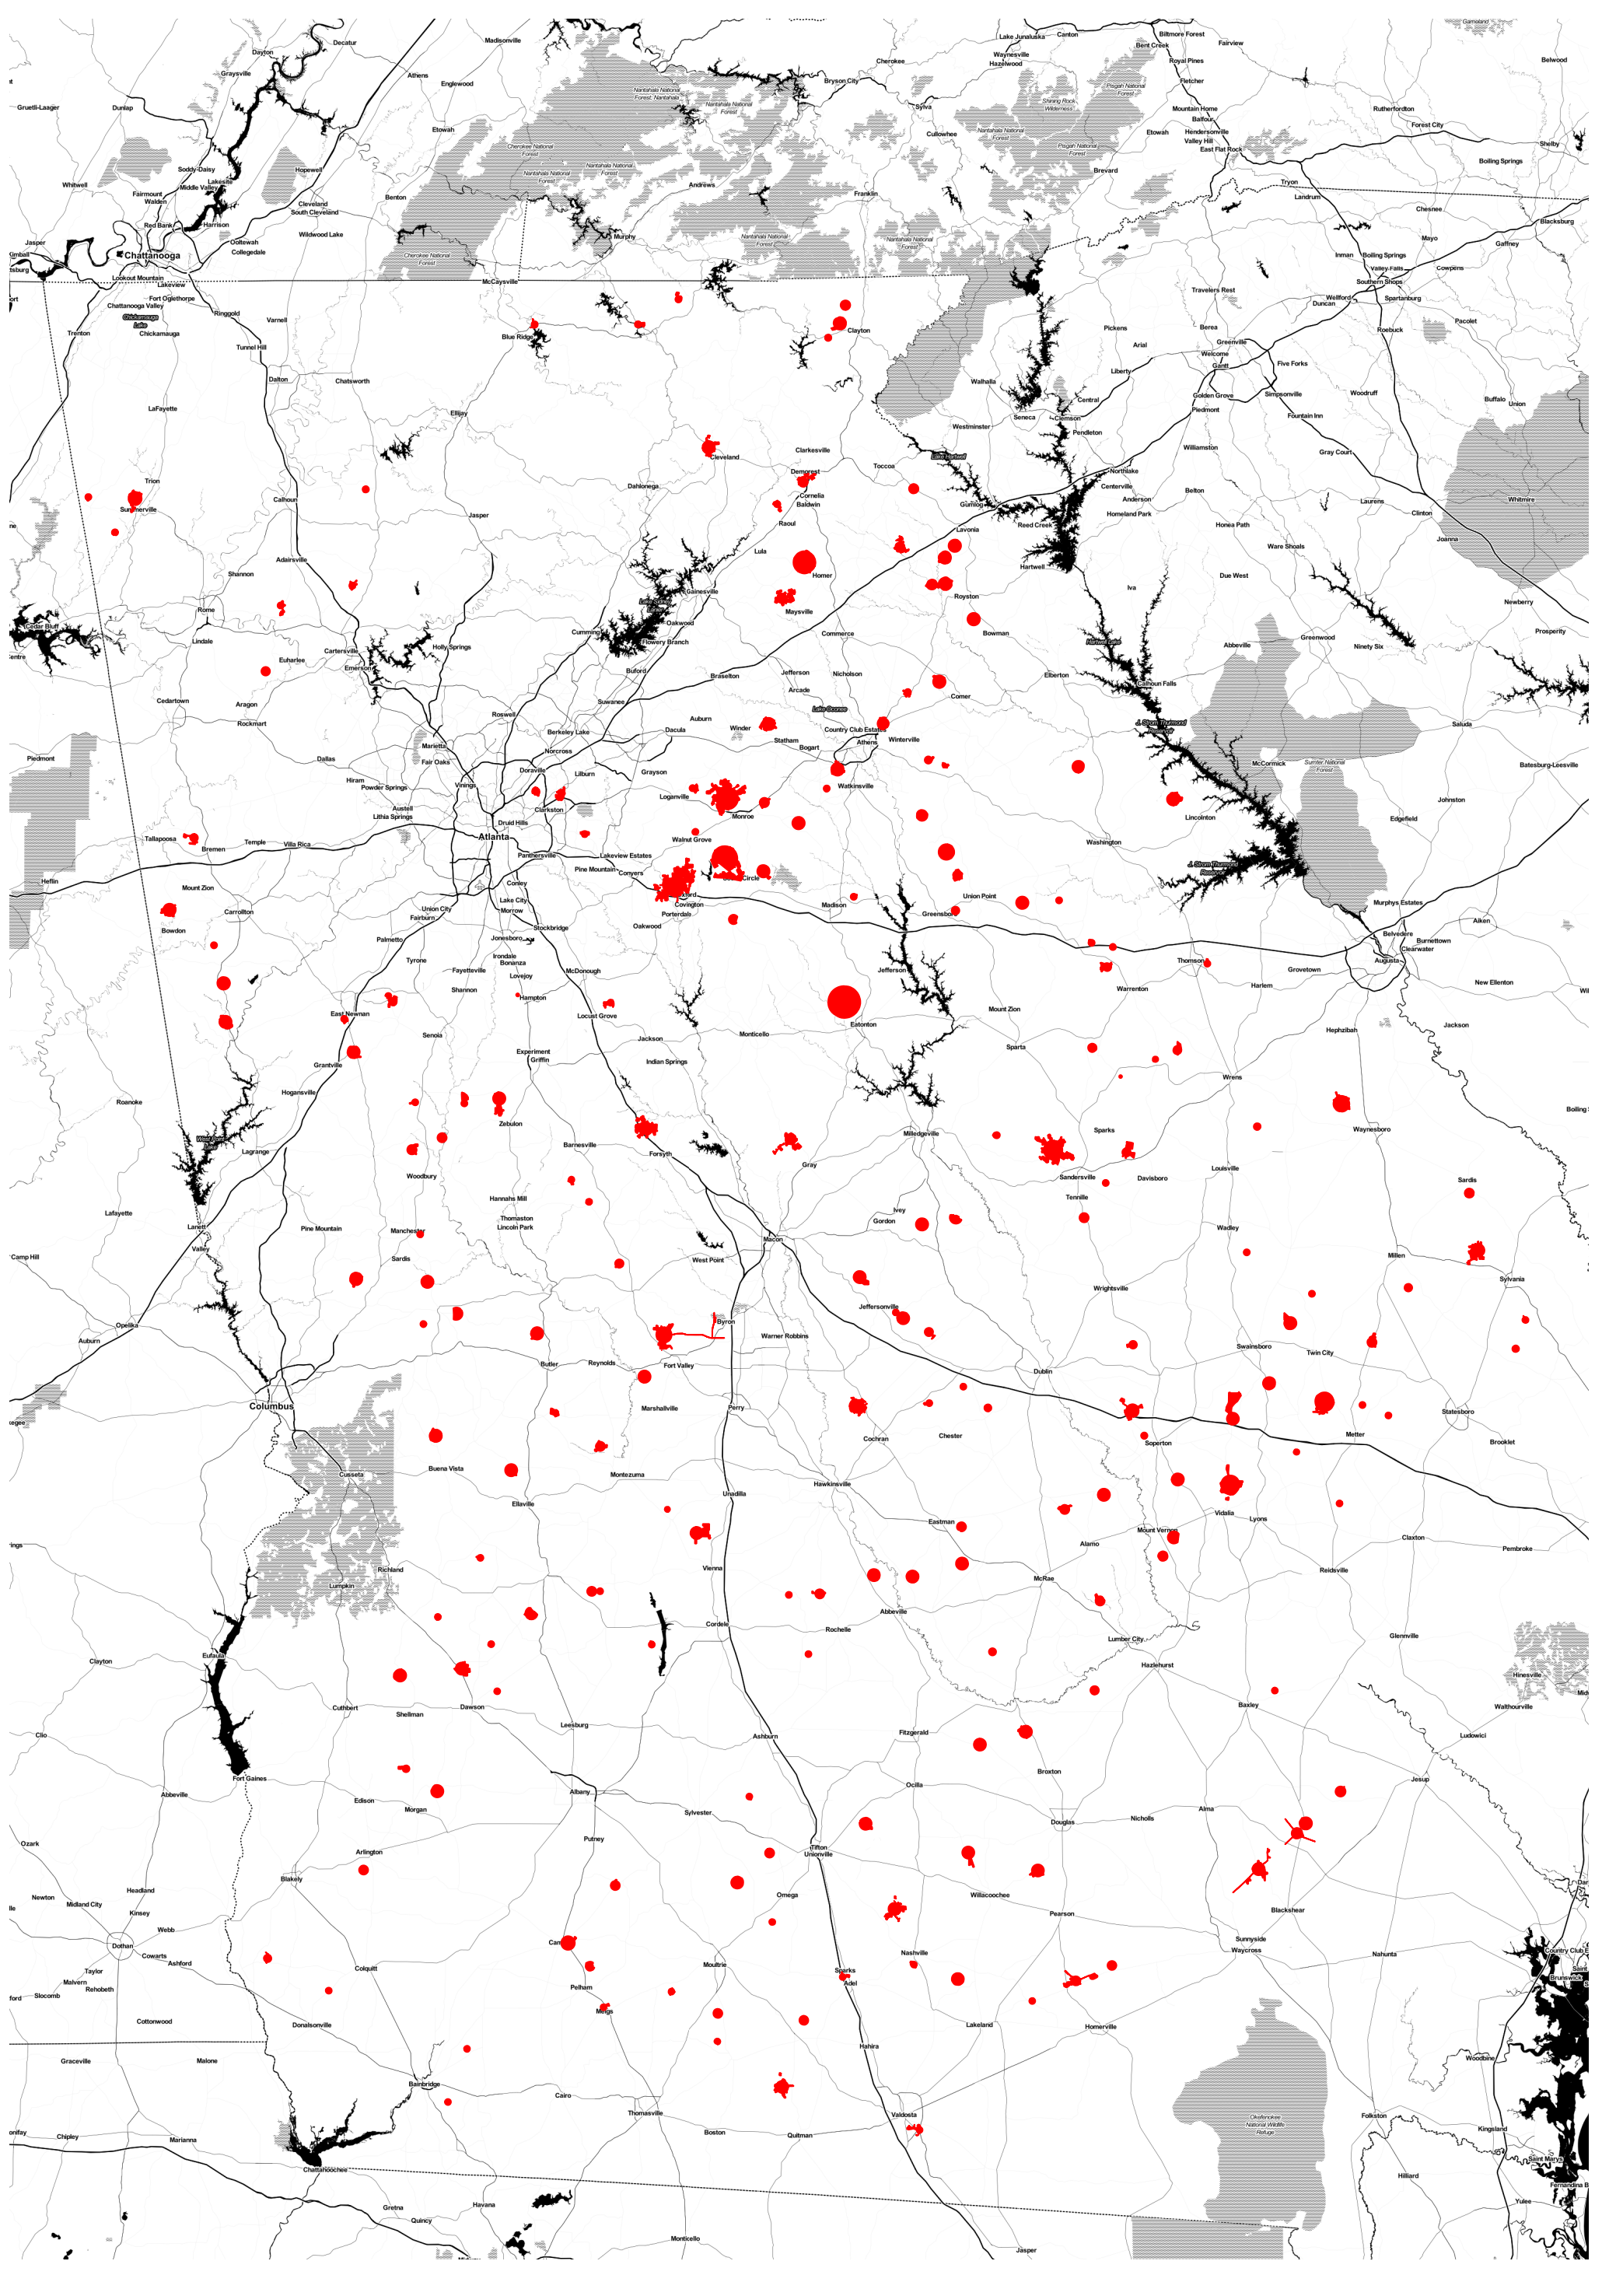
The new Mapbox GL JS is unreal. I made a quick and sloppy map to try out some of the new features. I grabbed a dataset of mines in the US from MSHA's website. I loaded it up into Mapbox and created two styles: satellite imagery and streets. I took some code from their GL JS how-to's and threw it together. My Frankencode is below. Side note: JavaScript is hard. I put in some code to toggle between the two base layers, and to add two more optional layers for hillshade and contours. 

Issues to fix and things to improve in the next version: The dataset was HUGE. I had to limit to zoom levels to keep the size reasonable. You'll notice that if you zoom out too much, the data disappears. I might need to pay for Mapbox to make this work... Also there are two attributions at the bottom of the map for OSM and Mapbox. I do love OSM enough to thank it twice, but I think this has to do with two styles being loaded in. Another thing to investigate with more time.

Cool features: Hold shift and use the arrow keys to fly around. Note how place labels stay horizontal while you spin the Earth as if you stuck a pin in it first. 

Thanks, Mapbox. Here's the code I embedded above.

<html>
<head>
    <meta charset='utf-8' />
    <meta name='viewport' content='initial-scale=1,maximum-scale=1,user-scalable=no' />
    <script src='https://api.tiles.mapbox.com/mapbox-gl-js/v0.12.0/mapbox-gl.js'></script>
    <link href='https://api.tiles.mapbox.com/mapbox-gl-js/v0.12.0/mapbox-gl.css' rel='stylesheet' />
    <style>
        body { margin:0; padding:0; }
        #map { position:absolute; top:0; bottom:0; width:100%; }
    </style>
</head>
<body>

<style>
    #menu {
        background: #fff;
        position: absolute;
        z-index: 1;
        top: 10px;
        right: 10px;
        border-radius: 3px;
        width: 120px;
        border: 1px solid rgba(0,0,0,0.4);
        font-family: 'Open Sans', sans-serif;
    }
    #menu a {
        font-size: 13px;
        color: #404040;
        display: block;
        margin: 0;
        padding: 0;
        padding: 10px;
        text-decoration: none;
        border-bottom: 1px solid rgba(0,0,0,0.25);
        text-align: center;
    }
    #menu a:last-child {
        border: none;
    }
    #menu a:hover {
        background-color: #f8f8f8;
        color: #404040;
    }
    #menu a.active {
        background-color: #3887be;
        color: #ffffff;
    }
    #menu a.active:hover {
        background: #3074a4;
    }
</style>

<div id='map'></div>
<div id='menu'>
    <input id='sarahmlevine/cihs248is00aa95lylu5a7x1d' type='radio' name='rtoggle' value='satellite' checked='checked'>
    <label for='satellite'>satellite layer</label>
    <input id='sarahmlevine/cihvjue4p00h095lyyyyv2347' type='radio' name='rtoggle' value='basic'>
    <label for='basic'>streets</label>
</div>
<script>
mapboxgl.accessToken = 'pk.eyJ1Ijoic2FyYWhtbGV2aW5lIiwiYSI6IlAweXNYVEUifQ._dz0522LtBABUYyfqP503Q';
var map = new mapboxgl.Map({
    container: 'map',
    style: 'mapbox://styles/sarahmlevine/cihs248is00aa95lylu5a7x1d',
    zoom: 8.1,
    center: [-121.41, 37.91]
});
var layerList = document.getElementById('menu');
var inputs = layerList.getElementsByTagName('input');
function switchLayer(layer) {
    var layerId = layer.target.id;
    map.setStyle('mapbox://styles/' + layerId);
}
for (var i = 0; i < inputs.length; i++) {
    inputs[i].onclick = switchLayer;
}
map.on('style.load', function () {
    map.addSource('contours', {
        type: 'vector',
        url: 'mapbox://mapbox.mapbox-terrain-v2'
    });
    map.addLayer({
        'id': 'contours',
        'type': 'line',
        'source': 'contours',
        'source-layer': 'contour',
        'layout': {
            'line-join': 'round',
            'line-cap': 'round'
        },
        'paint': {
            'line-color': '#877b59',
            'line-width': 1
        }
    });
    map.addSource('hillshade', {
        type: 'vector',
        url: 'mapbox://mapbox.mapbox-terrain-v2'
    });
    map.addLayer({
        'id': 'hillshade',
        'type': 'line',
        'source': 'hillshade',
        'source-layer': 'hillshade',
        'layout': {
            'line-join': 'round',
            'line-cap': 'round'
        },
        'paint': {
            'line-color:': '#877b59',
            'line-width': 1,
            'line-opacity': 0.6,
        }
    });
});
addLayer('Contours', 'contours');
addLayer('Hillshade', 'hillshade');
function addLayer(name, id) {
    var link = document.createElement('a');
    link.href = '#';
    link.className = 'active';
    link.textContent = name;
    link.onclick = function (e) {
        e.preventDefault();
        e.stopPropagation();
        var visibility = map.getLayoutProperty(id, 'visibility');
        if (visibility === 'visible') {
            map.setLayoutProperty(id, 'visibility', 'none');
            this.className = '';
        } else {
            this.className = 'active';
            map.setLayoutProperty(id, 'visibility', 'visible');
        }
    };
    var layers = document.getElementById('menu');
    layers.appendChild(link);
}
// Add zoom and rotation controls to the map.
map.addControl(new mapboxgl.Navigation());
</script>
</body>
</html>

San Francisco Tree Census

I mapped all street trees in San Francisco as of April 26, 2015 recorded by Department of Public Works. Shades of green represent trees grouped by genus (legend below).

Sadly, Mapbox no longer supports the classic styles on which this map was built, so I’ve taken down what used to be an interactive map. Screen captures of the project, as it used to exist, are below.

(Street trees set excludes parks, including Golden Gate and Presidio.) Data from SF Open Data. Map created with Tilemill and Mapbox Studio. See the code.

LEGEND

Acacia
Maple (acer)
Chestnut (Aesculus)
Willow (Agonis)
Pine (Araucaria)
Birch (Betula)
Palm (Brahea)
Bottlebrush (Callistemon)
Hornbeam (Carpinus)
Beefwood (Casurina)
Cedar (Cedrus)
Hackberry (Celtis)
Gum (Corymbia)
Hawthorn (Crataegus)
Carrotwood (Cupaniopsis)
Cypress (Cupressus)
Bush (Dodonaea)
Dragon Tree (Dracaena)
Loquat (Eriobotrya)
Eucalyptus
Beech (Fagus)
Fig (Ficus)
Ash (Fraxinus)
Australian Willow (Geijera)
Gingko
Locust (Gleditsia)
Silk Oak (Grevillea)
Urchin/Hakea Tree (Hakea)
Sweet Shade (Hymenosporum)
Holly (Ilex)
Jacaranda
Juniper (Juniperus)
Laurel (Laurus)
Tea Tree (Leptospermum)
Sweet Gum (Liquidambar)
Magnolia
Crabapple (Malus)
Maleleuca
Olive (Olea europaea)
Cherry (Prunus)
Pear (Pyrus)
Oak (Quercus)
Elm (Ulmus)
Hawthorn (Rhaphiolepis)
Fan Palm (Washingtonia)
Yew (Taxus)

Clustering San Francisco Crime Data

I grabbed crimes from January 1, 2014 - Crime Incidents - Current Year - as a json and wrote a python script to use K-Means clustering to clean up and analyze the points. The clustering sorts the points around a centroid, so that every point is closer to that centroid than to any other. Crudely, it delineates clusters of points grouped around "hotspots." The map displays the generated centroids along with Police Districts and Neighborhoods.

Most reports in the city present crimes grouped by some other category: neighborhoods (orange) or police districts (green). Reporting crimes by natural groups of incidents reveals slightly more nuanced patterns.

For example, two of the crime "hotspots" that fall within the Tenderloin police district teeter on the border of the Southern police district and SOMA neighborhood. While crime reporting isolates Southern and SOMA crime, those incidents contribute (over 50%) to a crime pattern originating from the Tenderloin district. Additionally, the fourth largest hotspot, in Bayview (10288), compared to the largest, Tenderloin (18509), falls within the second largest police district (Bayview), whereas Tenderloin police district is the smallest of all. 

This is the first part of a larger series I'll be working on to evaluate the distribution of crime and police resources, as well as perceptions of crime and safety, in San Francisco.

See the code.

Three Months of Gun Violence in San Francisco

INCIDENTS
ROBBERY, ARMED WITH A GUN
: 47
ROBBERY ON THE STREET WITH A GUN: 45
AGGRAVATED ASSAULT WITH A GUN: 32
POSS OF FIREARM BY CONVICTED FELON/ADDICT/ALIEN: 31
POSS OF LOADED FIREARM: 31
CARRYING A CONCEALED WEAPON: 21
ATTEMPTED HOMICIDE WITH A GUN: 5
ATTEMPTED ROBBERY COMM. ESTABLISHMENT WITH A GUN: 2
ATTEMPTED ROBBERY ON THE STREET WITH A GUN: 5
ATTEMPTED ROBBERY RESIDENCE WITH A GUN: 2
ATTEMPTED ROBBERY WITH A GUN: 7
ATTEMPTED SUICIDE BY FIREARMS: 1
CARJACKING WITH A GUN: 4
CARRYING OF CONCEALED WEAPON BY CONVICTED FELON: 6
MAYHEM WITH A GUN: 1
ROBBERY OF A BANK WITH A GUN: 7
ROBBERY OF A CHAIN STORE WITH A GUN: 2
ROBBERY OF A COMMERCIAL ESTABLISHMENT WITH A GUN: 5
ROBBERY OF A RESIDENCE WITH A GUN: 3
ROBBERY OF A SERVICE STATION WITH A GUN: 3
SUICIDE BY FIREARMS: 1
TAMPERING WITH MARKS ON FIREARM: 1
TURNED IN GUN: 10
DAY OF WEEK STATS
Friday: 55
Sunday: 46
Wednesday: 40
Tuesday: 40
Thursday: 34
Saturday: 30

Monday: 27

All of the gun-related crime in San Francisco over the past three months, mapped. Scroll over incidents for incident numbers, dates, descriptions, and resolution. Data extracted from Open Data SF, Map: Crime Incidents - Previous Three Months. Created with MapBox and TileMill.

Want to help efforts to get guns off the streets of San Francisco? Consider donating to Gunbygun - a San Francisco non-profit that crowdfunds for buyback events. They removed $20,000 of firearms from San Francisco streets last summer alone.

Like Gunbygun on Facebook.
Learn more about them.
Donate $50 to take a gun off the street.